Open Access
Fig. A.19.
Download original image
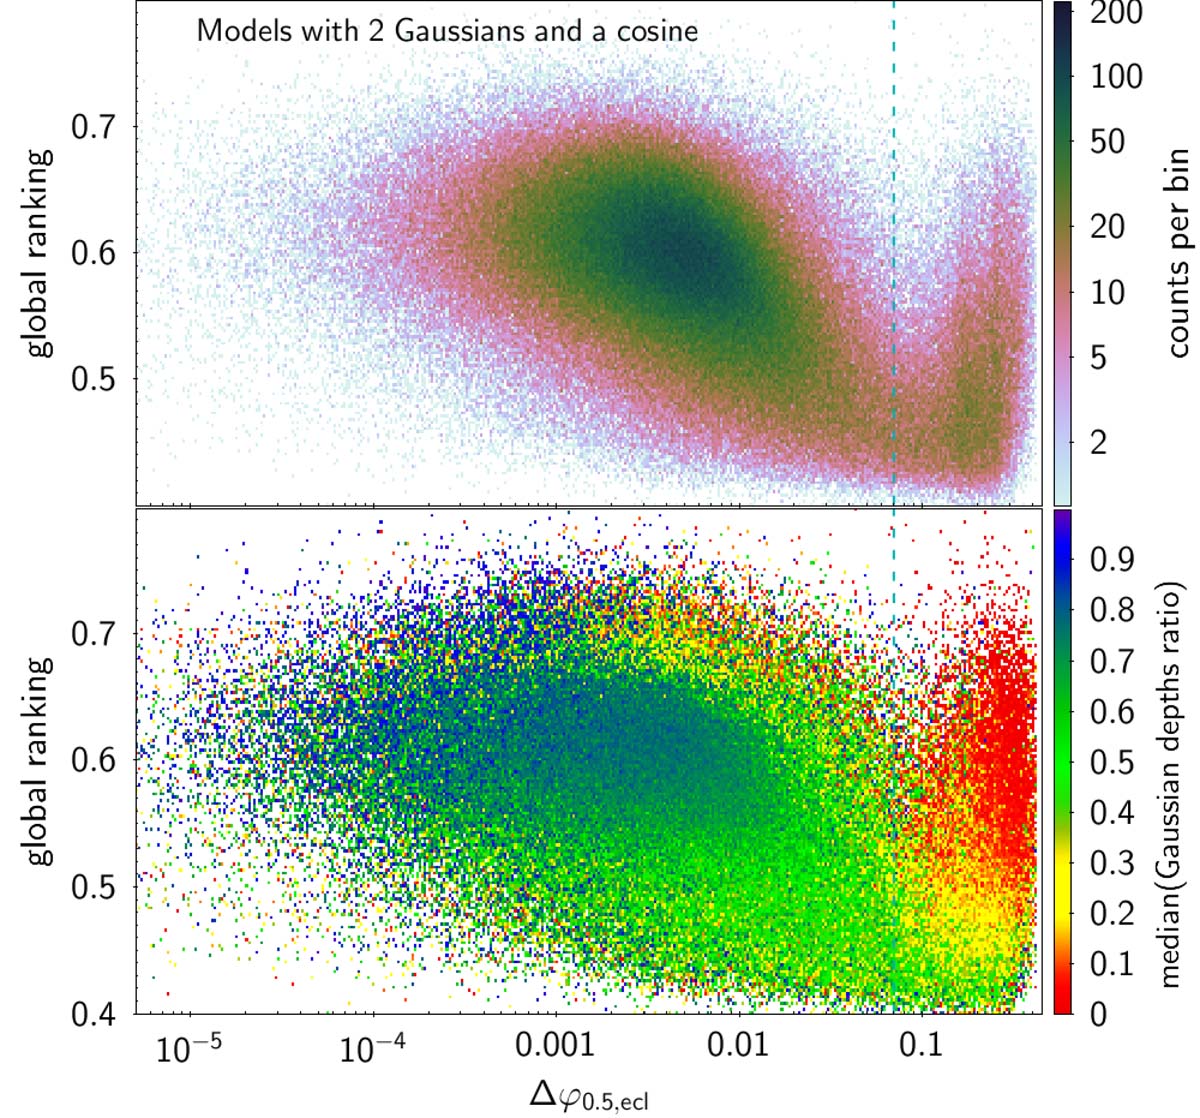
Same as Fig. A.15, but for the global ranking versus eclipse phase separation relative to 0.5. Top panel: Density map. Bottom panel: Primary-to-secondary Gaussian depth ratio colour-coded according to the colour scale shown to the right of the panel.
Current usage metrics show cumulative count of Article Views (full-text article views including HTML views, PDF and ePub downloads, according to the available data) and Abstracts Views on Vision4Press platform.
Data correspond to usage on the plateform after 2015. The current usage metrics is available 48-96 hours after online publication and is updated daily on week days.
Initial download of the metrics may take a while.