Fig. A.16.
Download original image
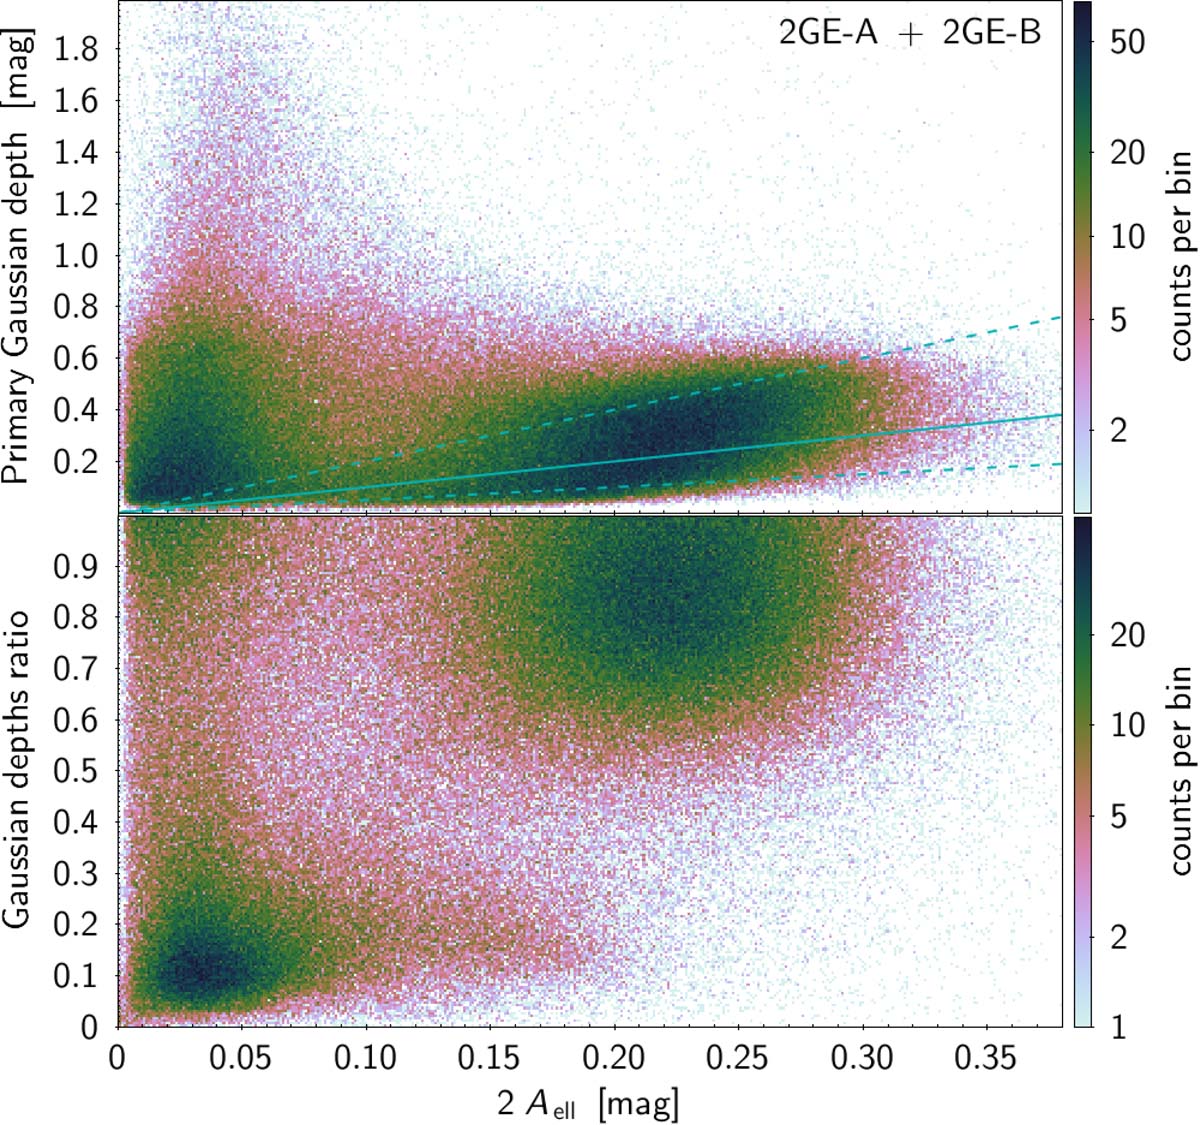
Density maps of two-Gaussian-related quantities versus ellipsoidal amplitude (peak-to-peak) of the samples 2GE-A (2 Aell < 0.11) and 2GE-B (2 Aell ≥ 0.11) of sources with two Gaussians and an ellipsoidal component. Top panel: Primary Gaussian depth, with 1:1 (solid), 2:1 (upper dashed), and 1:2 (lower dashed) lines to guide the eyes. Bottom panel: Secondary-to-primary Gaussian depth ratio. The axis scales are truncated for greater visibility.
Current usage metrics show cumulative count of Article Views (full-text article views including HTML views, PDF and ePub downloads, according to the available data) and Abstracts Views on Vision4Press platform.
Data correspond to usage on the plateform after 2015. The current usage metrics is available 48-96 hours after online publication and is updated daily on week days.
Initial download of the metrics may take a while.