Open Access
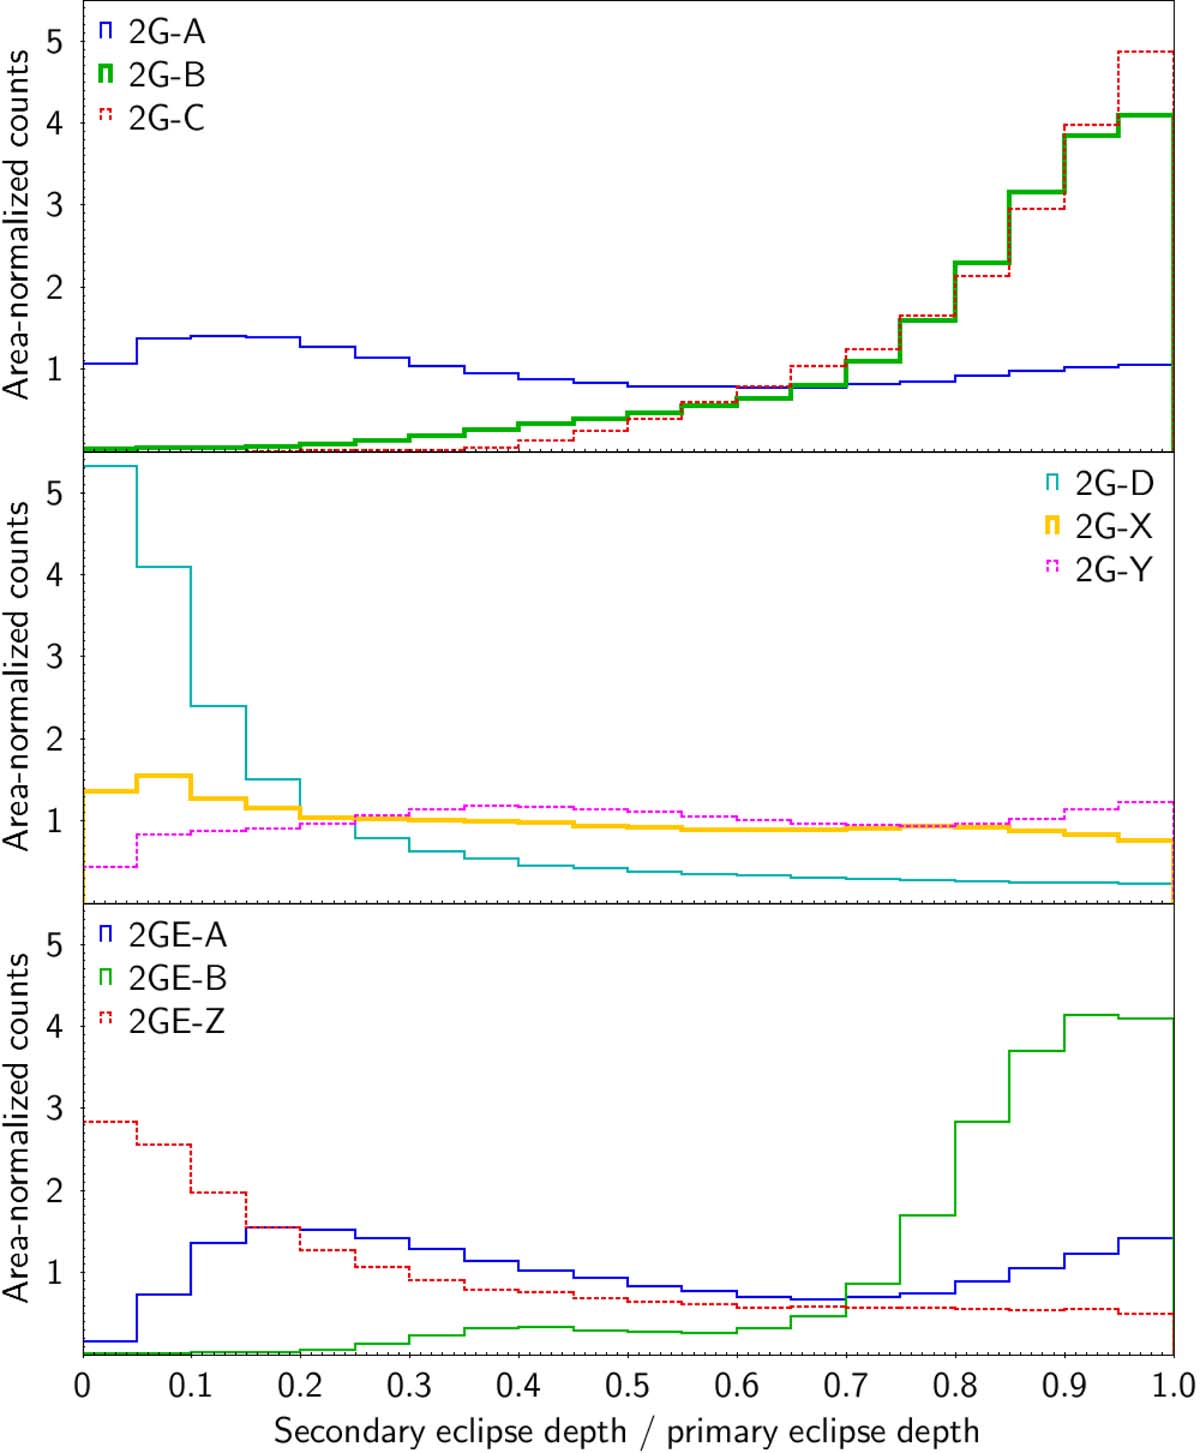
Fig. 6.
Download original image
Distribution of the derived eclipse-depth ratio (secondary over primary) for the various samples with two Gaussians in their light-curve models without (top and middle panels) or with (bottom panel) an ellipsoidal component, as labelled in the panels (see text). The histograms are area-normalised.
Current usage metrics show cumulative count of Article Views (full-text article views including HTML views, PDF and ePub downloads, according to the available data) and Abstracts Views on Vision4Press platform.
Data correspond to usage on the plateform after 2015. The current usage metrics is available 48-96 hours after online publication and is updated daily on week days.
Initial download of the metrics may take a while.