Fig. A.15.
Download original image
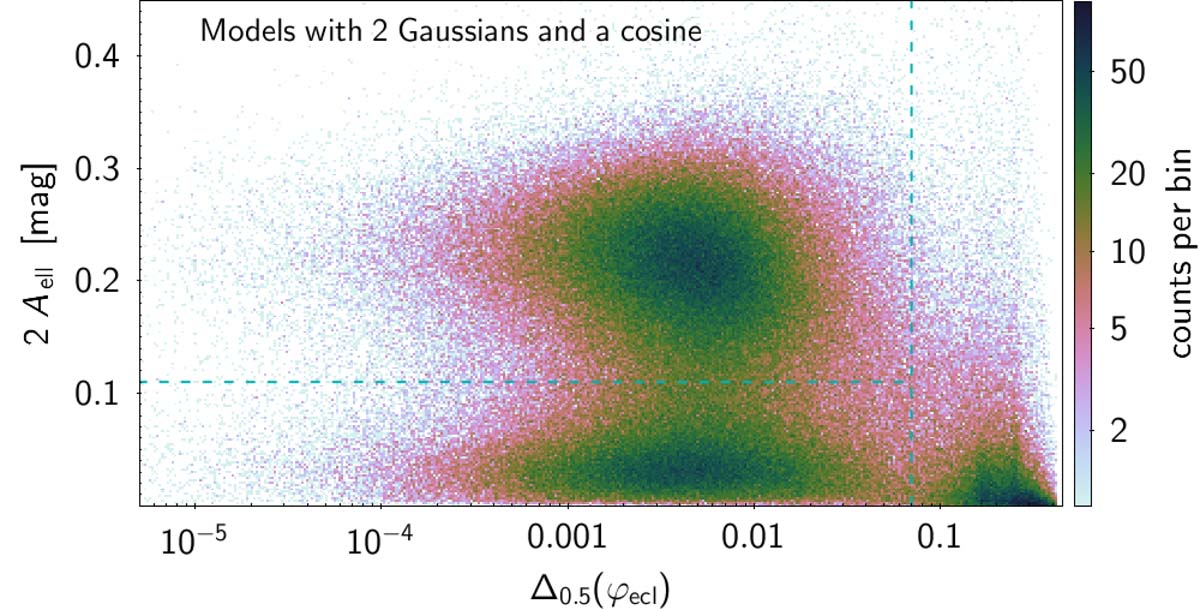
Density map of the ellipsoidal variation amplitude (peak-to-peak) versus deviation from 0.5 of the phase separation between primary and secondary eclipse locations for the sample of sources with two Gaussians and an ellipsoidal component. The expression of Δ0.5(φecl) is given by Eq. (A.1). The dashed lines delineate the three samples 2GE-A (lower-left region), 2GE-B (upper-left region), and 2GE-Z (right region) defined in the text. The axis scales have been limited for greater visibility.
Current usage metrics show cumulative count of Article Views (full-text article views including HTML views, PDF and ePub downloads, according to the available data) and Abstracts Views on Vision4Press platform.
Data correspond to usage on the plateform after 2015. The current usage metrics is available 48-96 hours after online publication and is updated daily on week days.
Initial download of the metrics may take a while.