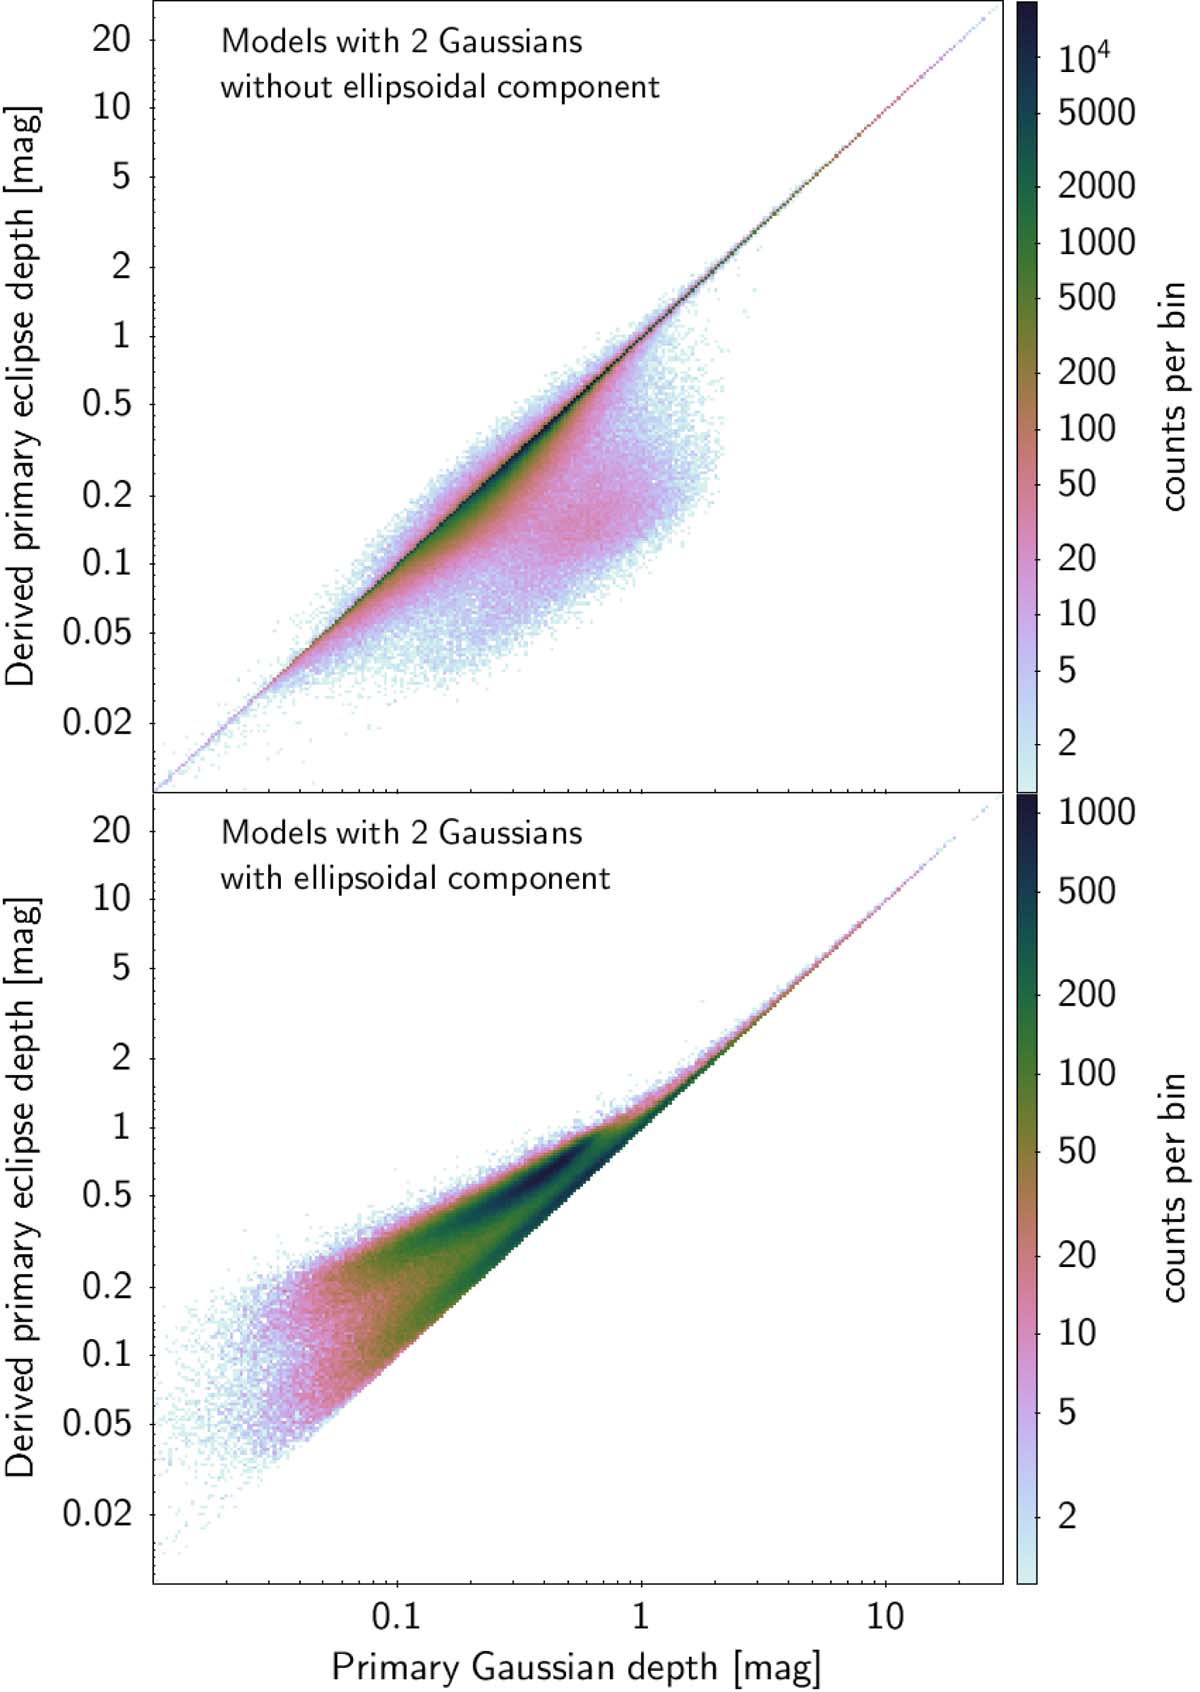
Fig. A.10.
Download original image
Density map of the depth of the primary eclipse versus the depth of the deepest Gaussian. The sample of sources whose light curves are modelled with two Gaussians and without an ellipsoidal component is shown in the top panel, while those with two Gaussians and a cosine function are shown in the bottom panel. The density in the maps is colour coded according to the colour scales shown to the right of each panel. The axes ranges have been restricted for better visibility.
Current usage metrics show cumulative count of Article Views (full-text article views including HTML views, PDF and ePub downloads, according to the available data) and Abstracts Views on Vision4Press platform.
Data correspond to usage on the plateform after 2015. The current usage metrics is available 48-96 hours after online publication and is updated daily on week days.
Initial download of the metrics may take a while.