Fig. A.3.
Download original image
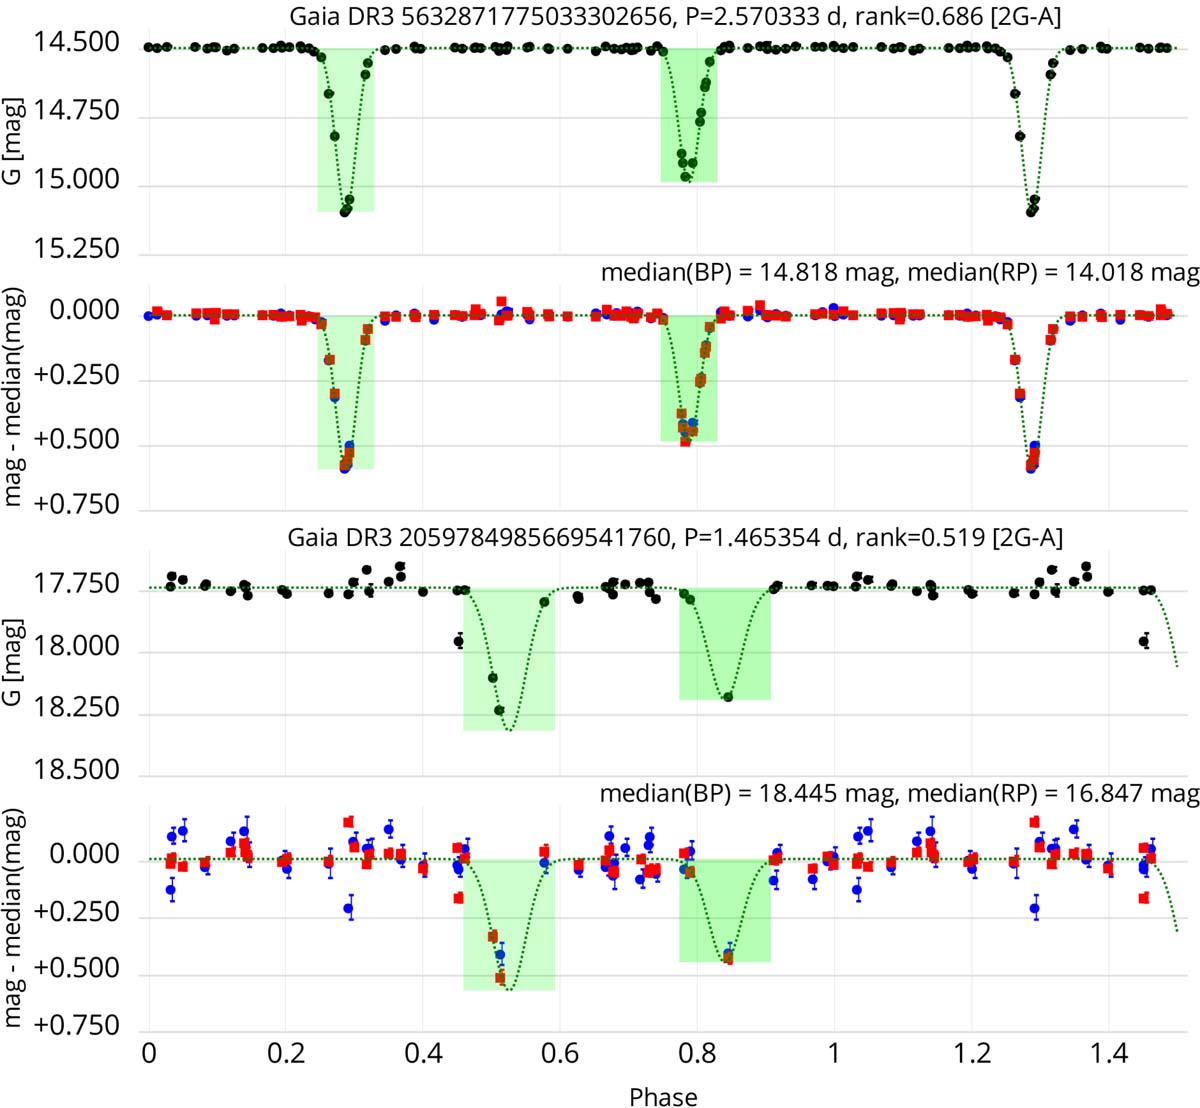
Example G light curves (top panels in each set) and GBP and GRP light curves (bottom panels in each set) of sources in Sample 2G-A modelled with only two Gaussians. The GBP and GRP magnitudes are shifted by a value equal to their median magnitudes, the values of which are given in the panel. The two-Gaussian model obtained from the G light curve is superposed as a dotted line in both panels of each set. The green areas indicate the derived eclipse durations. The top set is for the circular candidate Gaia DR3 5632871775033302656 and the bottom set is for the eccentric candidate Gaia DR3 2059784985669541760.
Current usage metrics show cumulative count of Article Views (full-text article views including HTML views, PDF and ePub downloads, according to the available data) and Abstracts Views on Vision4Press platform.
Data correspond to usage on the plateform after 2015. The current usage metrics is available 48-96 hours after online publication and is updated daily on week days.
Initial download of the metrics may take a while.