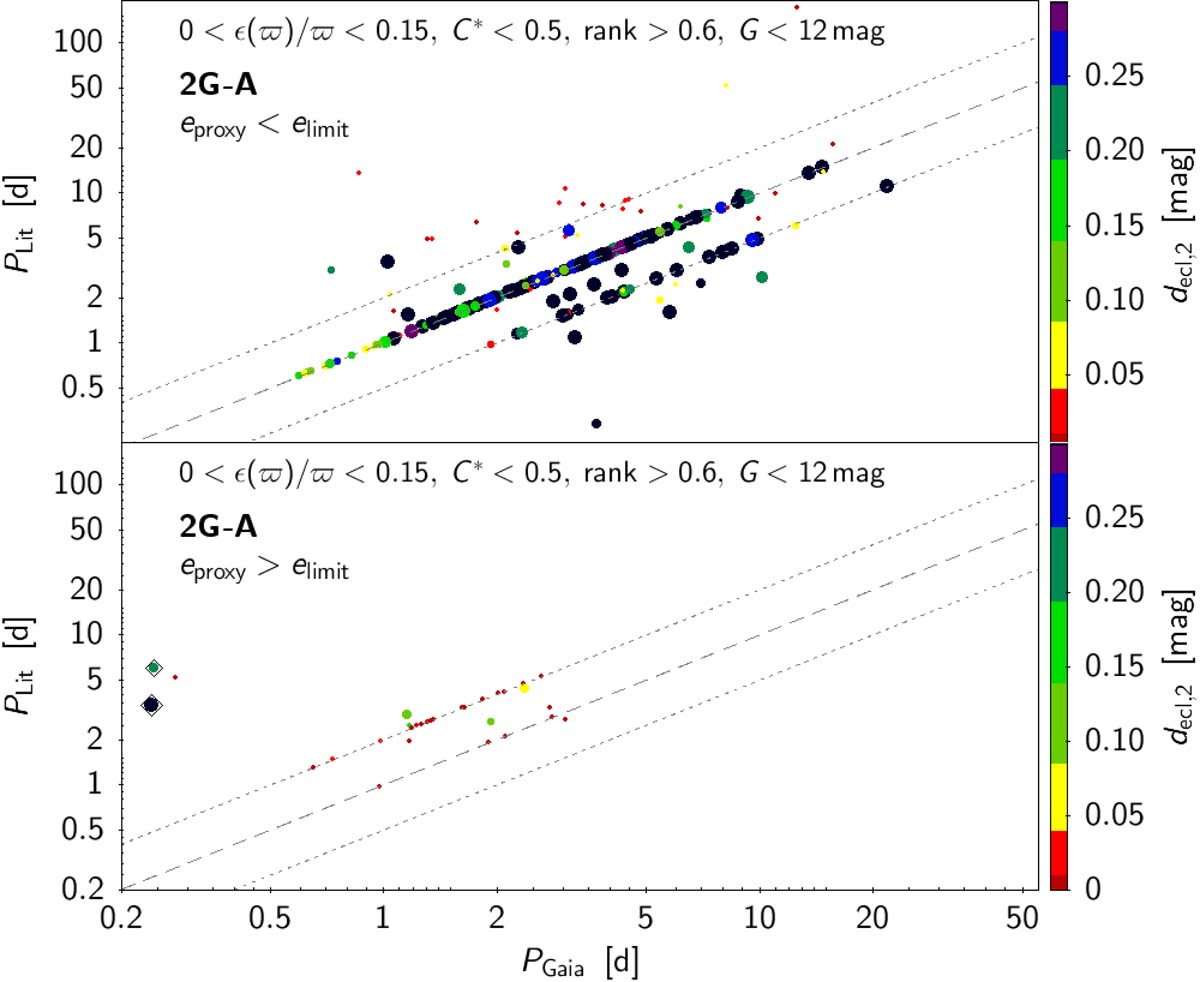
Fig. 40.
Download original image
Same as Fig. 39, but for non-Gaia literature period versus Gaia period for those sources that have a period published in the literature. The dashed line is PLit = PGaia, and the dotted lines are the relations PLit = 2 PGaia and PLit = 0.5 PGaia. Top panel: sources that have eccentricity proxies smaller than the eccentricity limit shown in Fig. 39. Bottom panel: sources with eccentricity proxies larger than this limit.
Current usage metrics show cumulative count of Article Views (full-text article views including HTML views, PDF and ePub downloads, according to the available data) and Abstracts Views on Vision4Press platform.
Data correspond to usage on the plateform after 2015. The current usage metrics is available 48-96 hours after online publication and is updated daily on week days.
Initial download of the metrics may take a while.