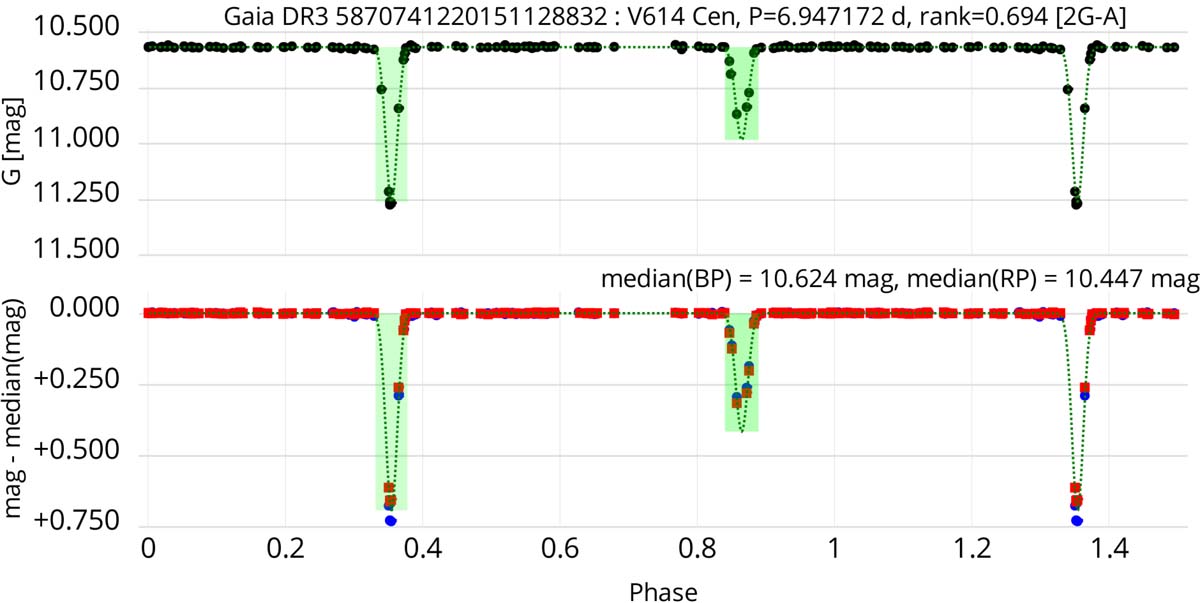
Fig. 4.
Download original image
Folded light curves of V614 Ven. Top panel: G light curve. The two-Gaussian model is superposed as a dotted line. The green areas indicate the derived eclipse durations. Bottom panel: GBP and GRP light curves (blue and red dots, respectively), shifted by a value equal to their respective median magnitudes as written in the top of the panel. The GRP light curve is plotted on top of the GBP one, the former therefore hiding the latter when the measurements are at the same ordinate. The dotted model and green areas shown in the bottom panel are the ones from the G light curve shifted to match zero median magnitude. The Gaia period, global ranking, and the light-curve classification (in brackets; see text) are given in the title of the figure after the Gaia DR3 ID and GCVS name.
Current usage metrics show cumulative count of Article Views (full-text article views including HTML views, PDF and ePub downloads, according to the available data) and Abstracts Views on Vision4Press platform.
Data correspond to usage on the plateform after 2015. The current usage metrics is available 48-96 hours after online publication and is updated daily on week days.
Initial download of the metrics may take a while.