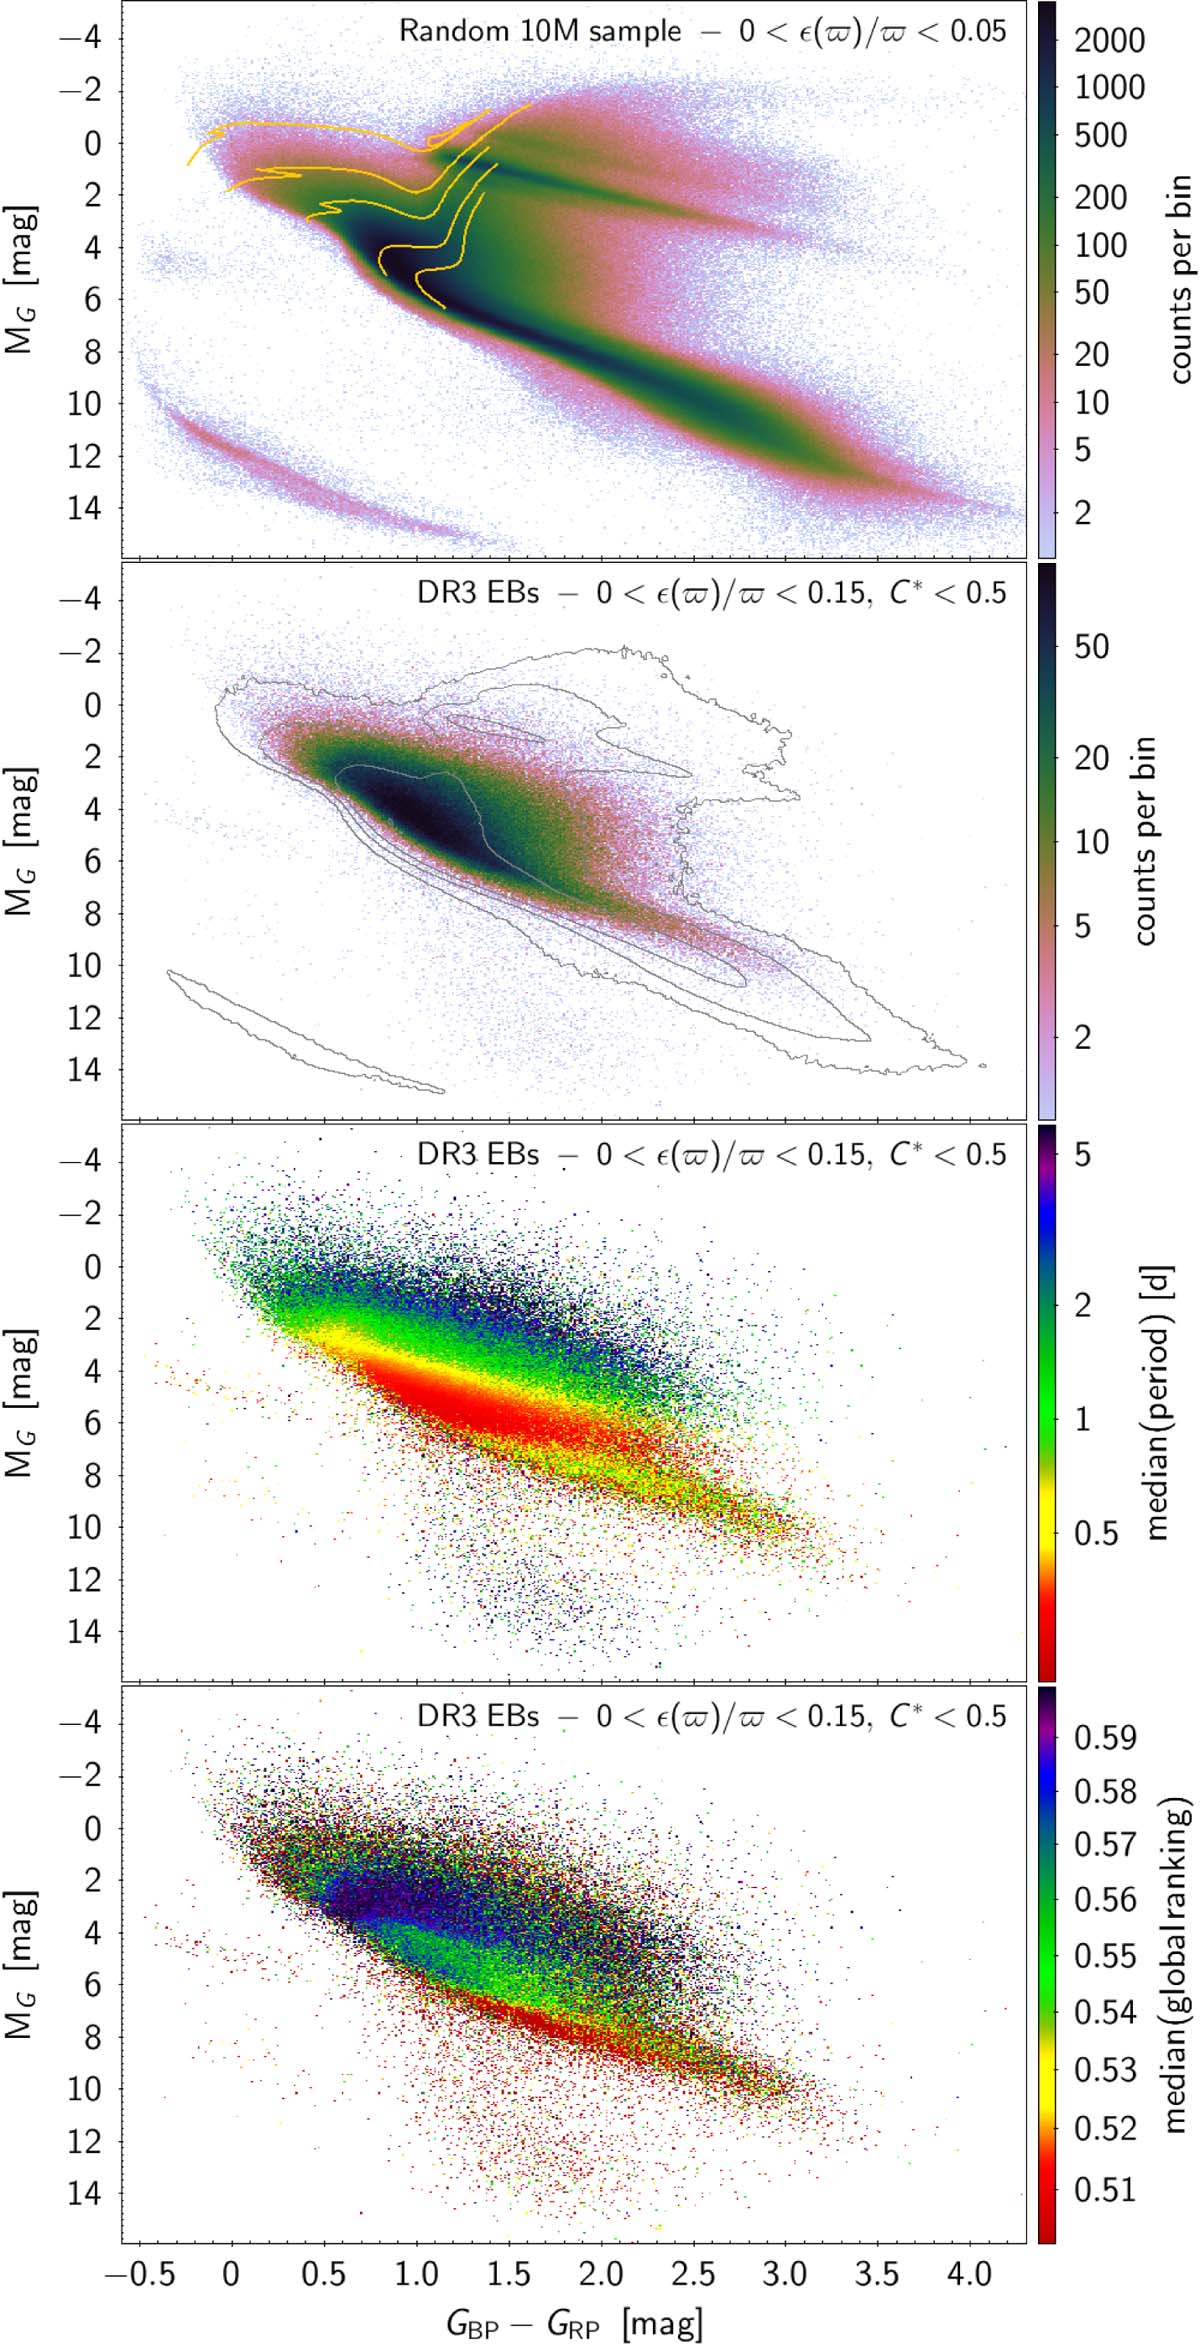
Fig. 36.
Download original image
Observational HR diagrams of Gaia DR3 stars with good parallaxes. Top panel: density map of a random sample of ten million stars with parallax uncertainties better than 5% and additional conditions on the number of measurements and source image quality (see text). The yellow lines are evolution tracks of, from bottom to top, 0.8, 1, 1.5, and 2 M⊙ solar-metallicity stellar models from Ekström et al. (2012). Second panel: density map of Gaia eclipsing-binary candidates with parallax uncertainties better than 15% and corrected BP+RP flux excess factors less than 0.5. Contour lines (logarithmic scale) of the sample shown in the top panel are drawn in grey. Third panel: same as second panel, but colour-coded with the median value of the orbital period in each bin. Bottom panel: same as second panel, but colour-coded with the median value of the global ranking in each bin. Median values of the GBP, GRP, and G cleaned time series are used in all panels except in the top one, where mean values are used due to the unavailability of median values for all sources in Gaia DR3. The colours in the figures are coded according to the colour scales to the right of each panel. The ranges of the axes and colour scales are truncated for greater visibility.
Current usage metrics show cumulative count of Article Views (full-text article views including HTML views, PDF and ePub downloads, according to the available data) and Abstracts Views on Vision4Press platform.
Data correspond to usage on the plateform after 2015. The current usage metrics is available 48-96 hours after online publication and is updated daily on week days.
Initial download of the metrics may take a while.