Fig. 30.
Download original image
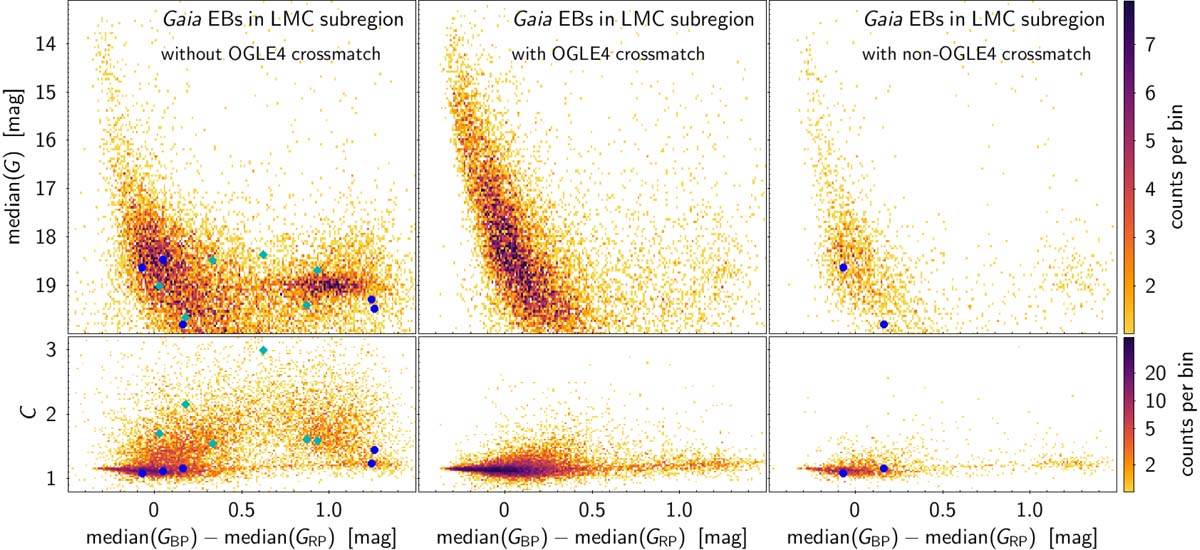
Colour–magnitude (top row) and BP+RP flux excess factor versus colour (bottom row) diagrams of the Gaia eclipsing binaries in the sky area towards the LMC shown in Fig. 24. Left panels: new Gaia eclipsing-binary candidates with respect to the OGLE4 catalogue of LMC eclipsing binaries. Middle panels:Gaia sources with a cross-match (2 arcsec radius) with the OGLE4 catalogue. Right panels: Gaia candidates having no cross-match with the OGLE4 candidates but a cross-match with EB candidates in other surveys. The colour of each bin is proportional to the number of counts per bin according to the colour scales shown to the right for each row. Sources highlighted by filled circles have their G light curves displayed in Figs. 31 and 32; they are located in the bar of the LMC for blue circle markers and outside the bar for cyan diamond markers. The axes ranges have been truncated for greater visibility.
Current usage metrics show cumulative count of Article Views (full-text article views including HTML views, PDF and ePub downloads, according to the available data) and Abstracts Views on Vision4Press platform.
Data correspond to usage on the plateform after 2015. The current usage metrics is available 48-96 hours after online publication and is updated daily on week days.
Initial download of the metrics may take a while.