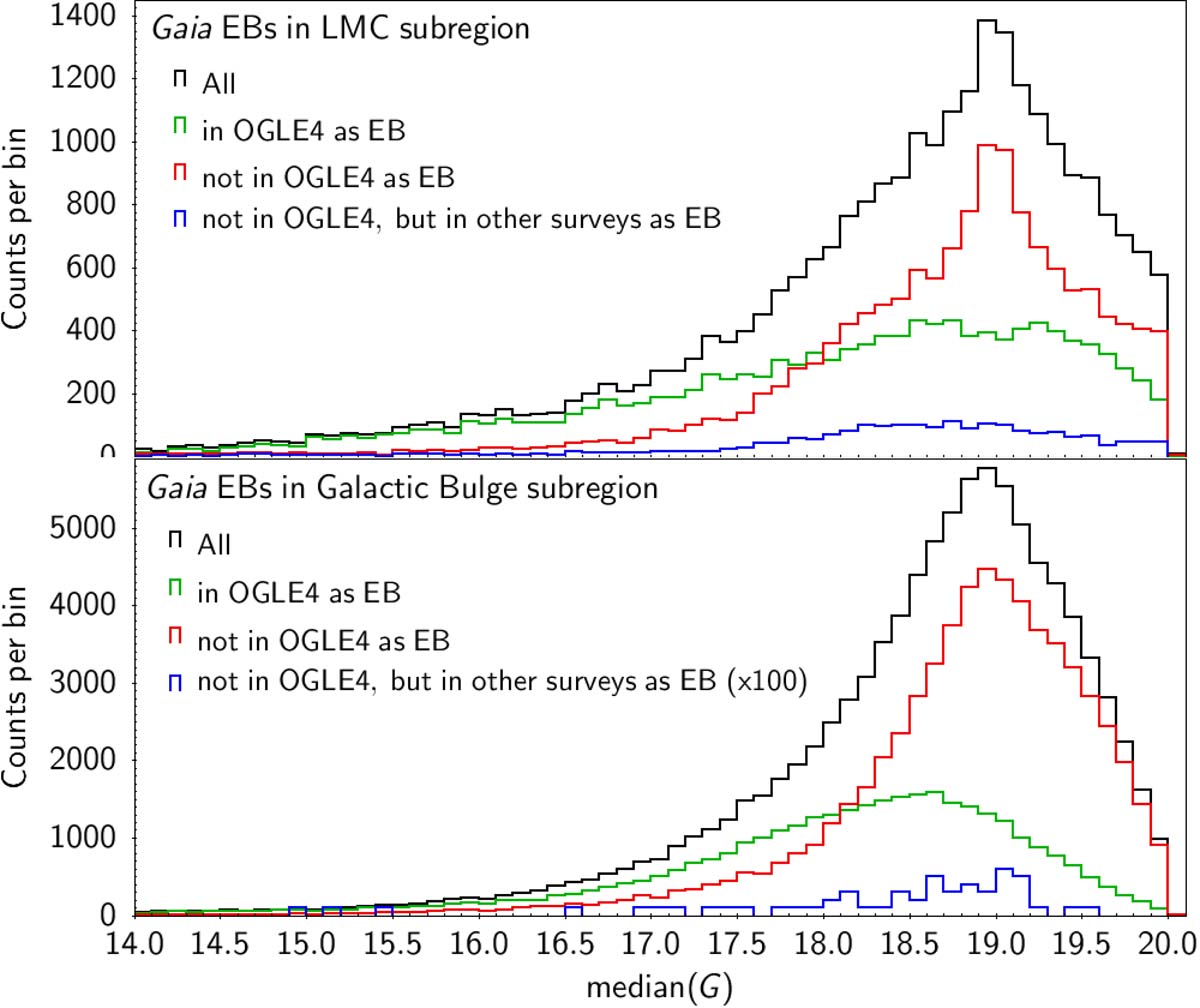
Fig. 27.
Download original image
Median G magnitude distributions of Gaia eclipsing binaries in specific regions of the sky. Top panel: sky region towards the LMC shown in Fig. 24. Bottom panel: sky region towards the Galactic Bulge shown in Fig. 25. The black histograms show all Gaia DR3 eclipsing-binary candidates in the given sky area. The sources among them that have or do not have a cross-match (2 arcsec radius) with the OGLE4 catalogue of eclipsing binaries are shown by the green and red histograms, respectively. The blue histograms are the distributions of sources with no OGLE4 cross-match but a cross match with eclipsing-binary candidates identified in other surveys. The abscissa range is truncated on the bright side for greater visibility.
Current usage metrics show cumulative count of Article Views (full-text article views including HTML views, PDF and ePub downloads, according to the available data) and Abstracts Views on Vision4Press platform.
Data correspond to usage on the plateform after 2015. The current usage metrics is available 48-96 hours after online publication and is updated daily on week days.
Initial download of the metrics may take a while.