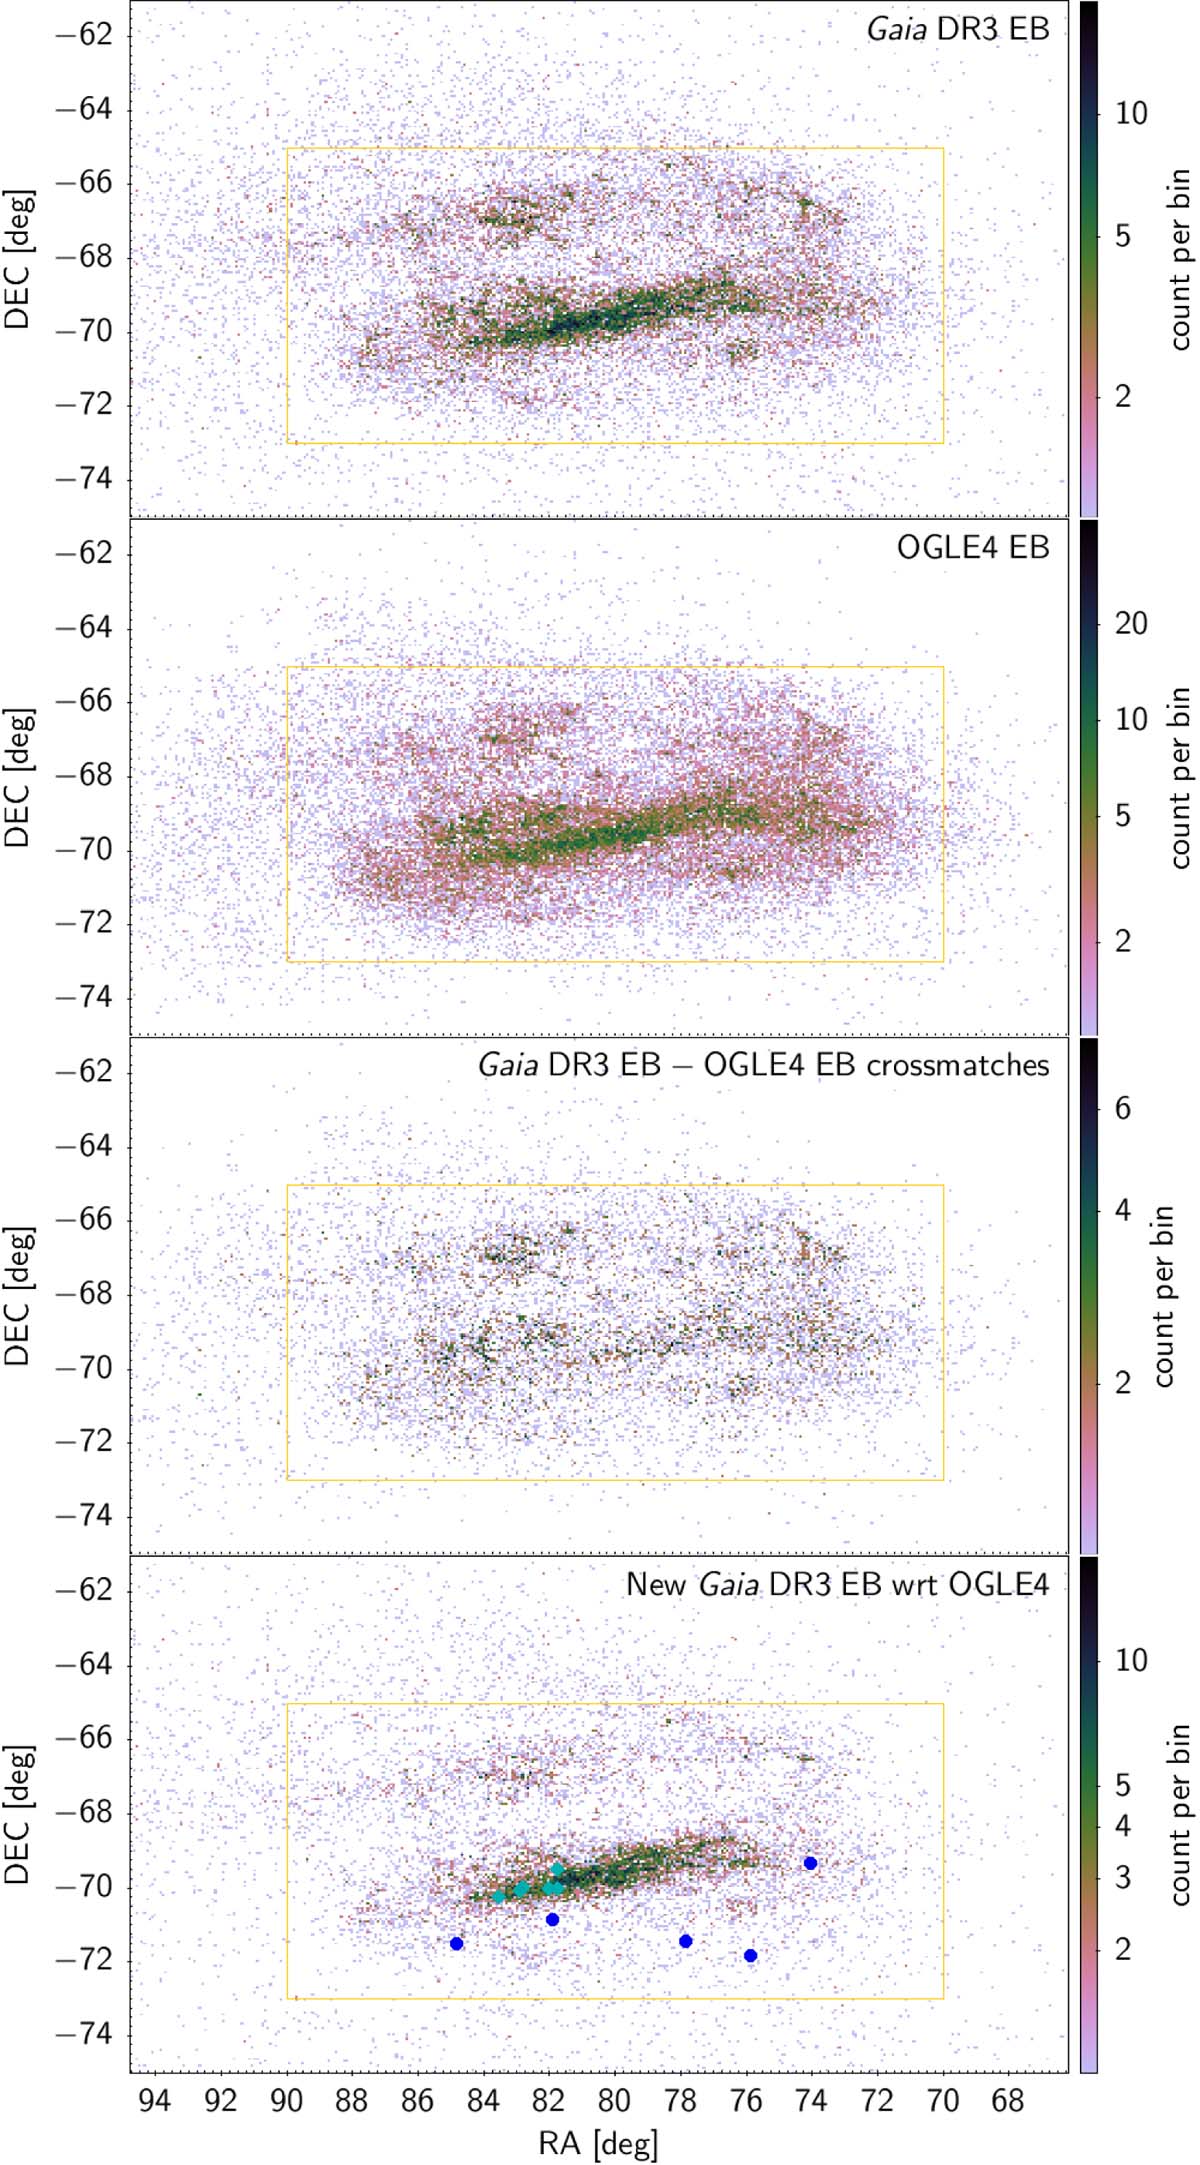
Fig. 24.
Download original image
Sky distributions (density maps) in equatorial coordinates of eclipsing-binary candidates around the LMC. The panels show, from top to bottom, Gaia DR3 candidates, OGLE4 candidates, the Gaia-OGLE4 cross-matches (2 arcsecs radius), and the new Gaia candidates with respect to OGLE4. Sources highlighted by filled circles in the bottom panel have their G light curves displayed in Figs. 31 and 32; they are located in the bar of the LMC for the cyan markers and outside the bar for the blue markers. The orange area delineates the subregion of the sky used in the text to compute the fraction of Gaia new candidates towards the LMC.
Current usage metrics show cumulative count of Article Views (full-text article views including HTML views, PDF and ePub downloads, according to the available data) and Abstracts Views on Vision4Press platform.
Data correspond to usage on the plateform after 2015. The current usage metrics is available 48-96 hours after online publication and is updated daily on week days.
Initial download of the metrics may take a while.