Fig. 4
Download original image
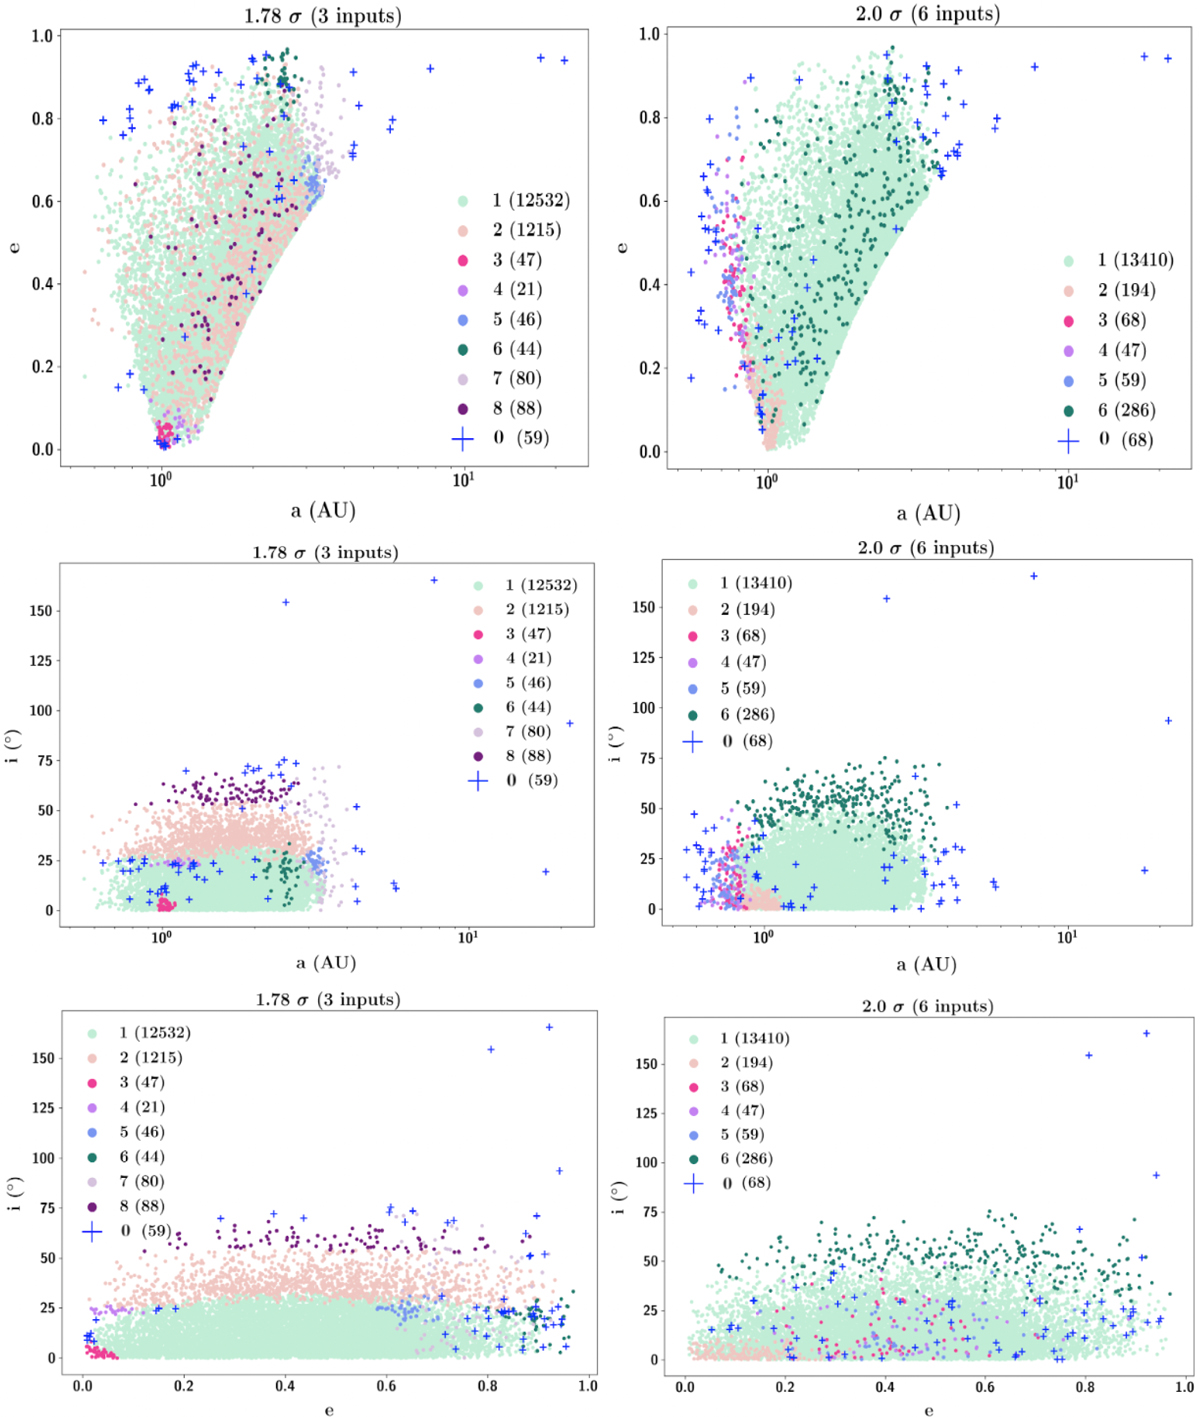
Distributions of NEOs in different clusters in the spaces of eccentricity (e) vs. semi-major axis (a), inclination (i) vs. semi-major axis (a) and inclination (i) vs. eccentricity (e) for approach 1 (A1) at 1.78σ – left panel and approach 2 (A2) at 2σ – right panel. The legends correspond to different clusters with the numbers of NEOs in each of them. Cluster 0, illustrated by ‘+’ refers to the NEOs that are not included in any of the clusters by the G-mode.
Current usage metrics show cumulative count of Article Views (full-text article views including HTML views, PDF and ePub downloads, according to the available data) and Abstracts Views on Vision4Press platform.
Data correspond to usage on the plateform after 2015. The current usage metrics is available 48-96 hours after online publication and is updated daily on week days.
Initial download of the metrics may take a while.