Fig. 3
Download original image
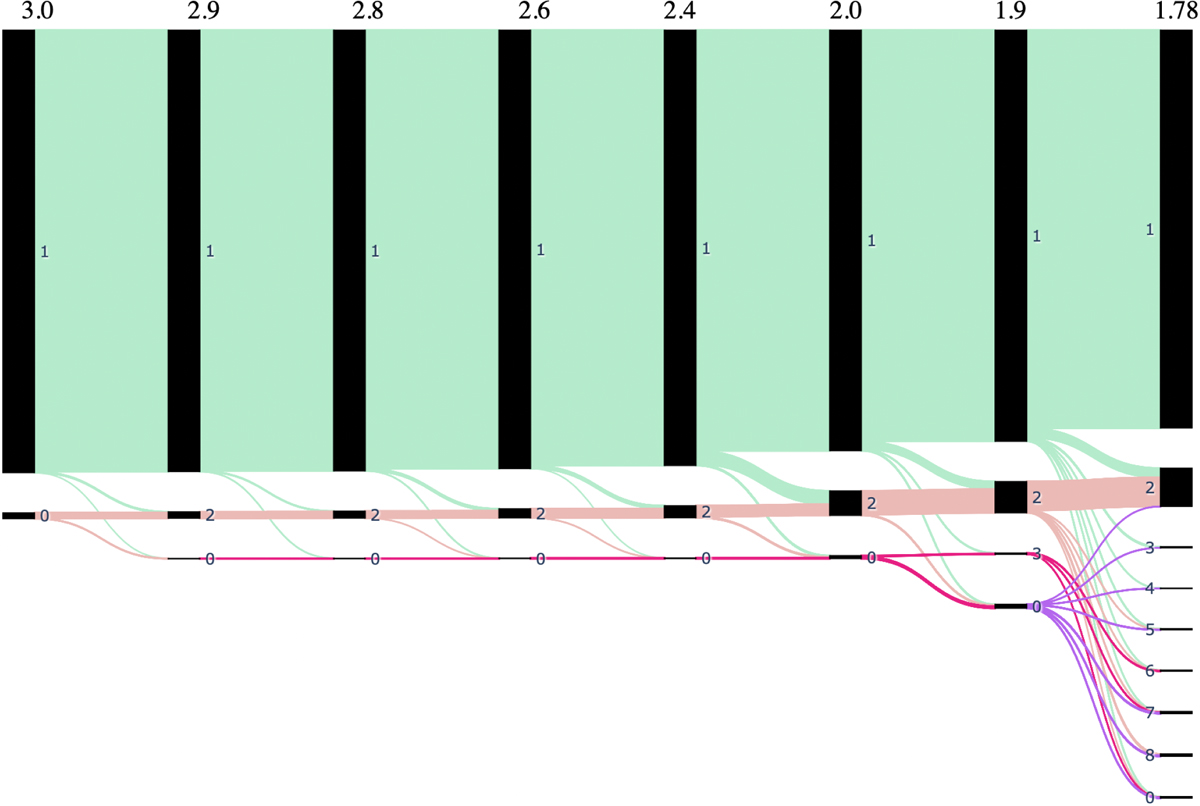
Sankey diagram showing the transfer of objects among different clusters across G-mode runs of varying confidence levels from 3σ to 1.78σ. This diagram corresponds to the first approach where three input variables were used. The colours correspond to an Nth cluster in a given G-mode run, i.e. the second cluster of any G-mode run will have the same colour.
Current usage metrics show cumulative count of Article Views (full-text article views including HTML views, PDF and ePub downloads, according to the available data) and Abstracts Views on Vision4Press platform.
Data correspond to usage on the plateform after 2015. The current usage metrics is available 48-96 hours after online publication and is updated daily on week days.
Initial download of the metrics may take a while.