Fig. 8
Download original image
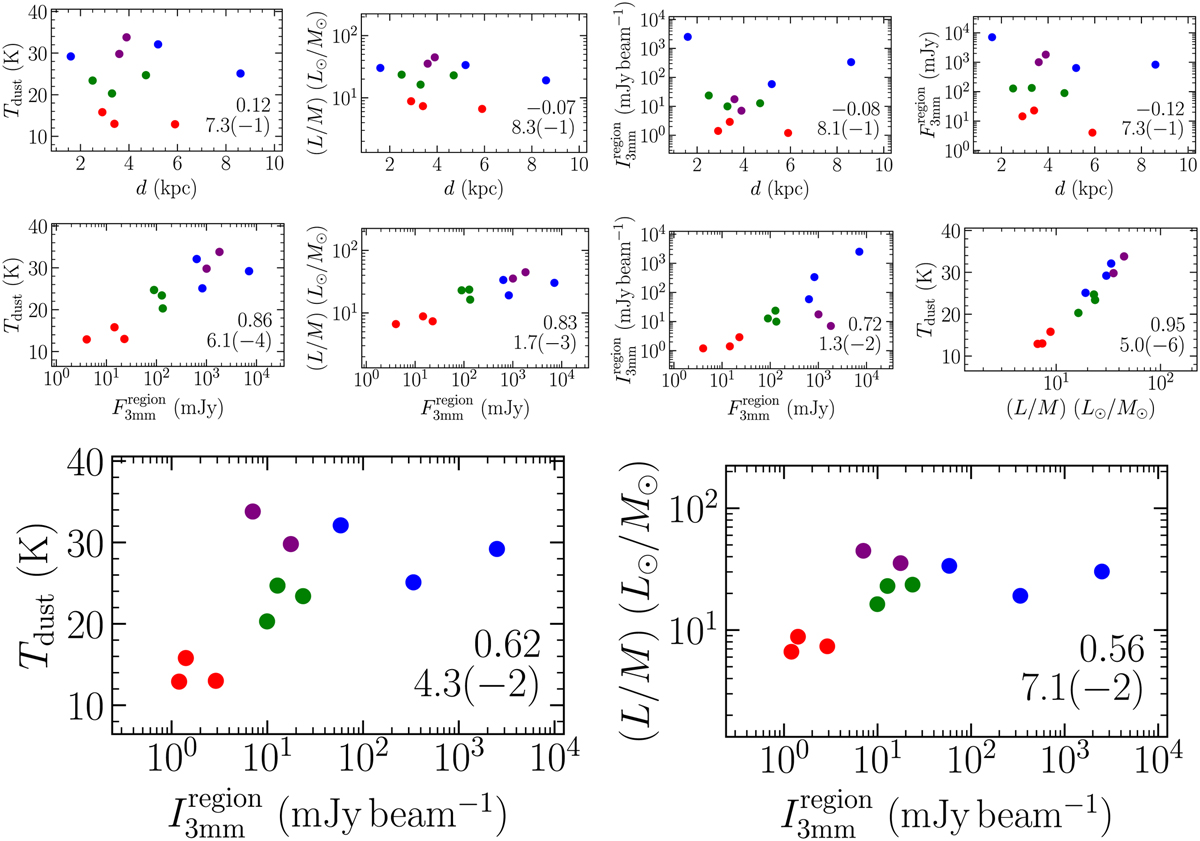
Comparison of the clump parameters of the regions. The temperature, Tdust, luminosity, L, mass, M, and distance, d, are listed in Table 1 and are taken from the ATLASGAL survey (Schuller et al. 2009; Urquhart et al. 2018). The region peak intensity, ![]() and flux density,
and flux density, ![]() of the ALMA 3 mm continuum data are listed in Table 2. The colors of the data points highlight the four evolutionary stages: IRDC (red), HMPO (green), HMC (blue), and UCHII region (purple). The Spearman correlation coefficient (rS) and the p-value, with a(b) meaning a × 10b, are shown in the bottom-right corner.
of the ALMA 3 mm continuum data are listed in Table 2. The colors of the data points highlight the four evolutionary stages: IRDC (red), HMPO (green), HMC (blue), and UCHII region (purple). The Spearman correlation coefficient (rS) and the p-value, with a(b) meaning a × 10b, are shown in the bottom-right corner.
Current usage metrics show cumulative count of Article Views (full-text article views including HTML views, PDF and ePub downloads, according to the available data) and Abstracts Views on Vision4Press platform.
Data correspond to usage on the plateform after 2015. The current usage metrics is available 48-96 hours after online publication and is updated daily on week days.
Initial download of the metrics may take a while.