Fig. 3
Download original image
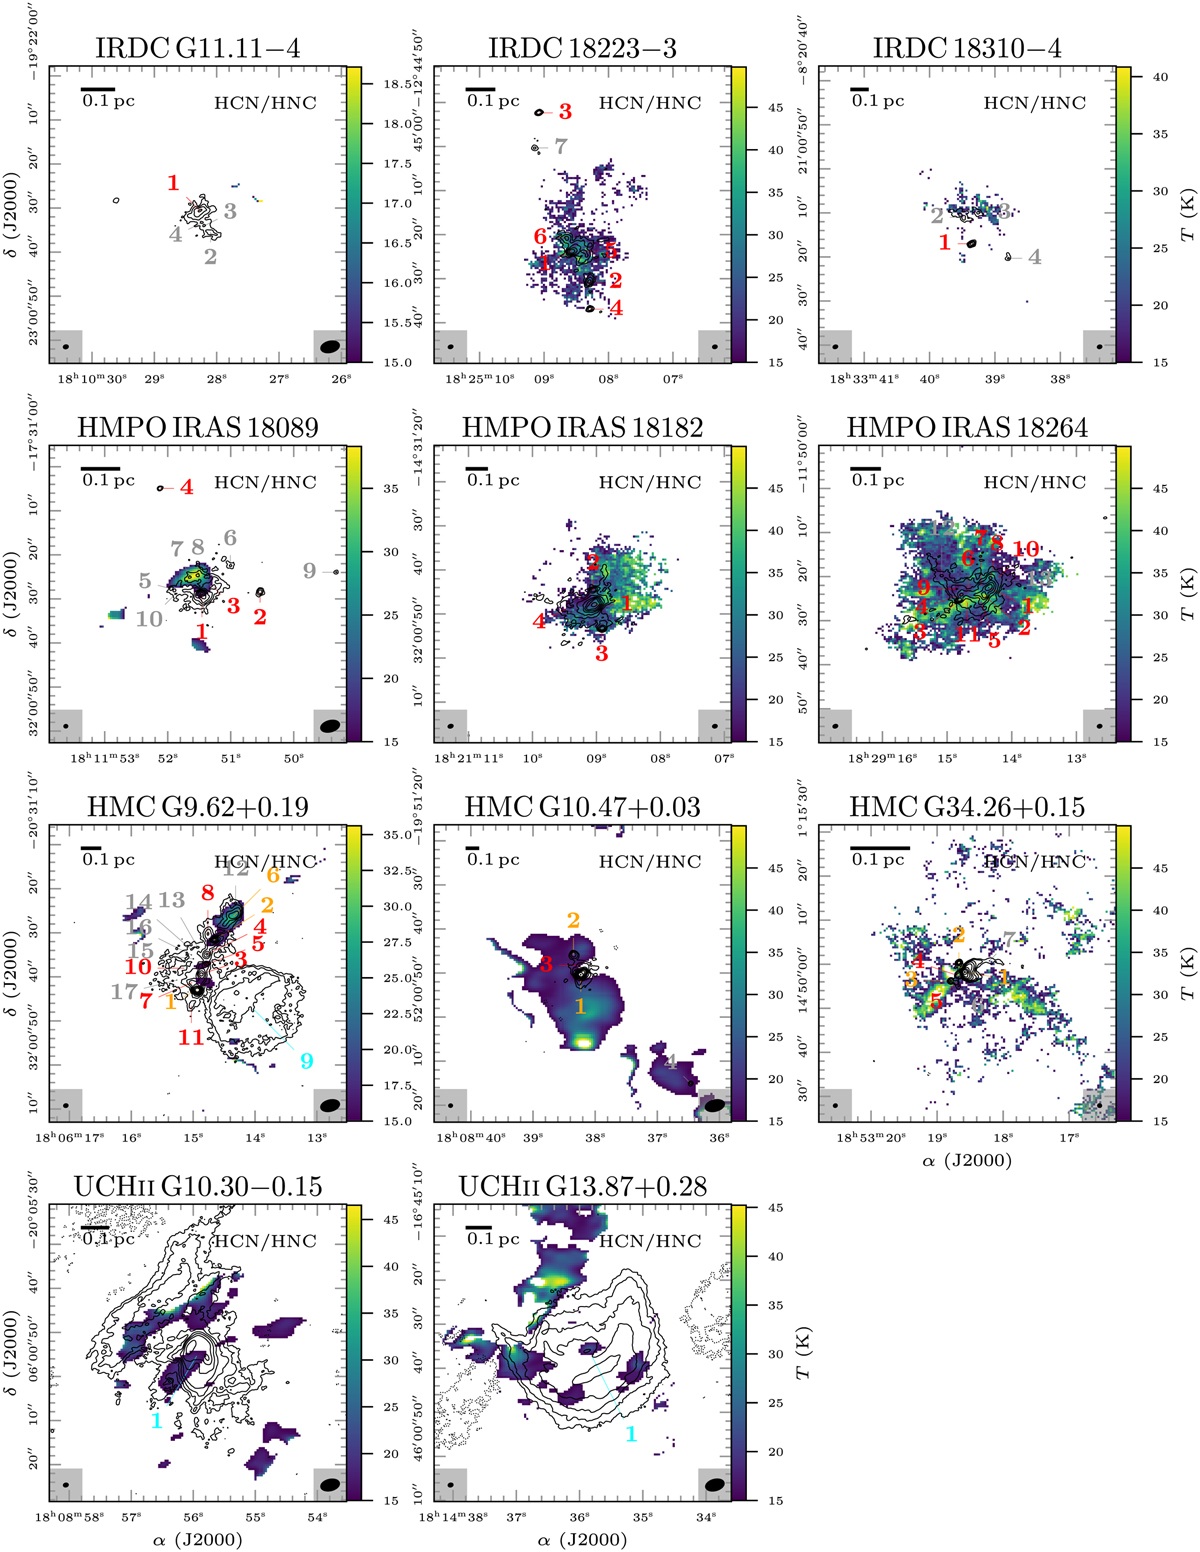
Temperature maps derived with the HCN-to-HNC intensity ratio. In each panel, the temperature is shown in color and the 3 mm continuum in black contours. The dotted black contour marks the −5σcont level. The solid black contours start at 5σcont, and contour steps increase by a factor of 2 (e.g., 5, 10, 20, 405σcont). The synthesized beam size of the continuum and line data is shown in the bottom-left and bottom-right corner, respectively. The continuum fragments are classified into dust cores (red), dust+ff cores (orange), and cometary UCHII regions (cyan), further explained in Sect. 4.1. Fragments with S/N < 15 are not analyzed in this study and are labeled in gray.
Current usage metrics show cumulative count of Article Views (full-text article views including HTML views, PDF and ePub downloads, according to the available data) and Abstracts Views on Vision4Press platform.
Data correspond to usage on the plateform after 2015. The current usage metrics is available 48-96 hours after online publication and is updated daily on week days.
Initial download of the metrics may take a while.