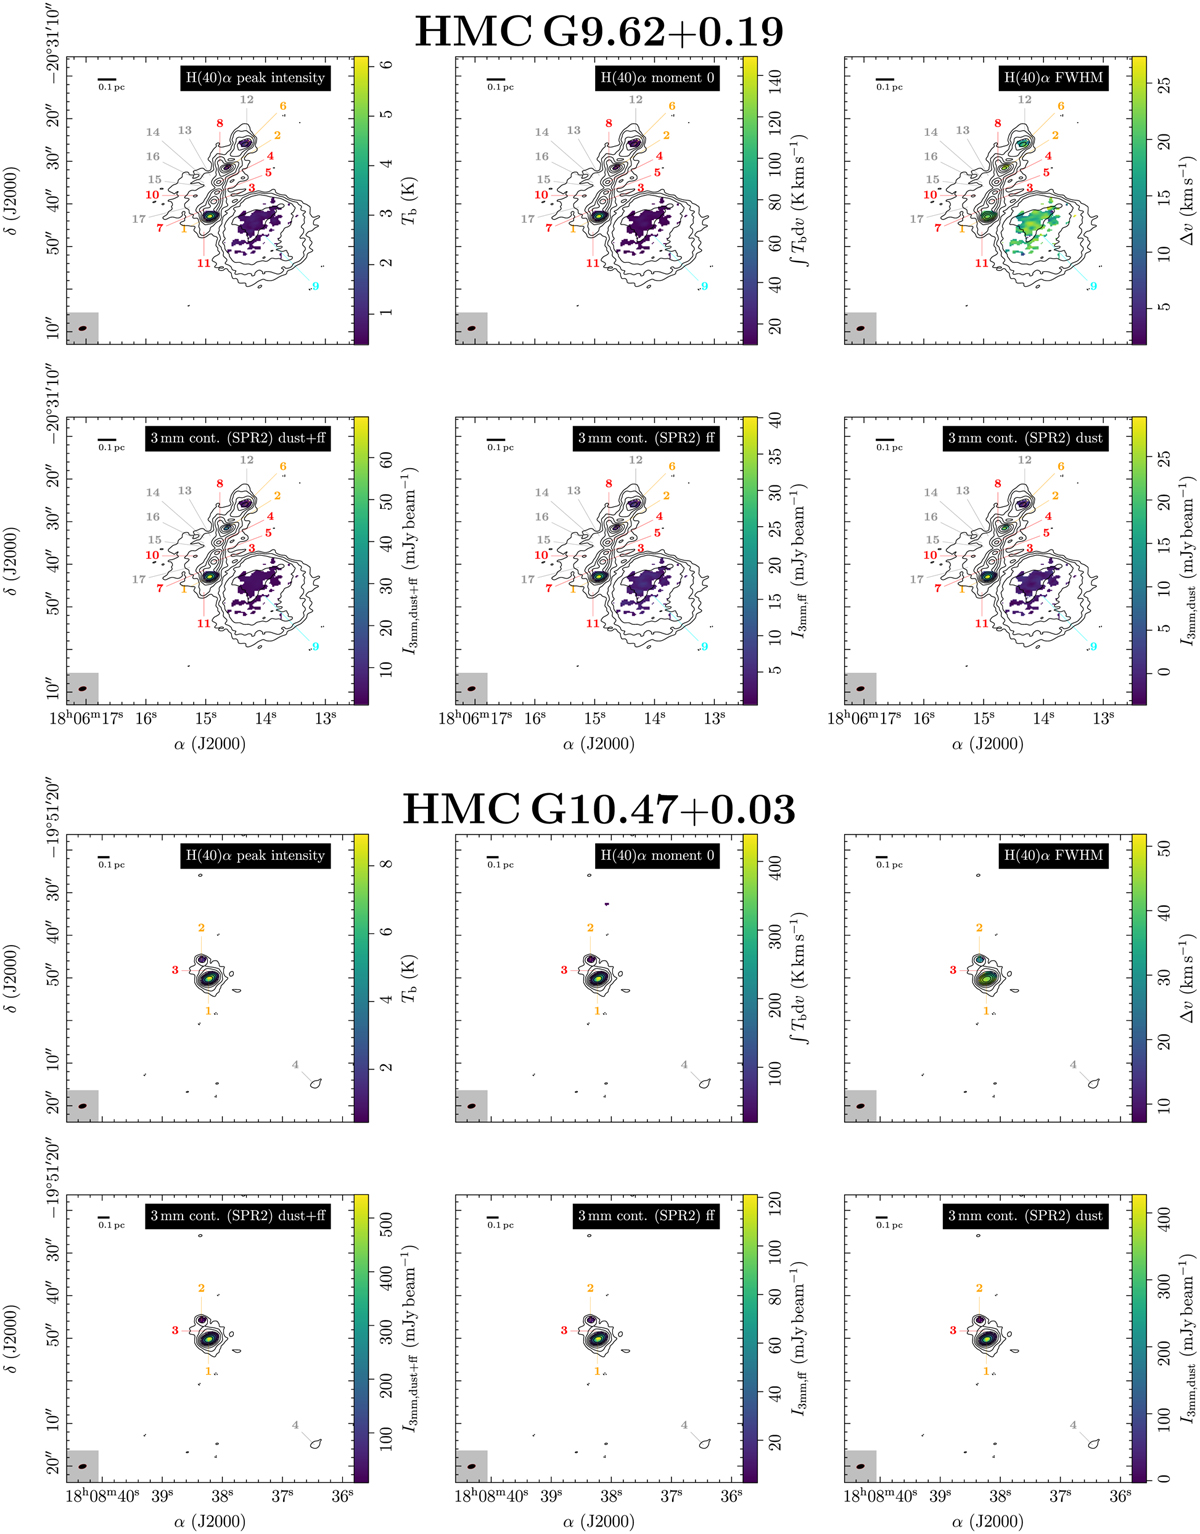
Fig. D.2
Download original image
Estimate of the free-free contribution at 3 mm (Eq. 3). In all panels, the SPR2 3 mm continuum is shown in contours. The dotted black contour marks the −5σcort level. The solid black contours start at 5σcont, and contour steps increase by a factor of 2 (e.g., 5, 10, 20, 40σcort). The top panels show in color the H(40)α peak intensity, integrated intensity, and line width derived from the second moment. The bottom panels show in color the SPR2 3 mm continuum (dust + ff), 3 mm ff continuum (estimated using Eq. 3), and 3 mm dust continuum. The synthesized beam size of the continuum and line data are shown in the bottom-left corner in black and red, respectively. In all panels, the area where the H(40)α integrated intensity and SPR2 continuum have a S/N < 5 are masked. The continuum fragments are classified into dust cores (red), dust+ff cores (orange), and cometary UCHII regions (cyan), further explained in Sect. 4.1. Fragments with S/N < 15 are not analyzed in this study and are labeled in gray.
Current usage metrics show cumulative count of Article Views (full-text article views including HTML views, PDF and ePub downloads, according to the available data) and Abstracts Views on Vision4Press platform.
Data correspond to usage on the plateform after 2015. The current usage metrics is available 48-96 hours after online publication and is updated daily on week days.
Initial download of the metrics may take a while.