Fig. C.2
Download original image
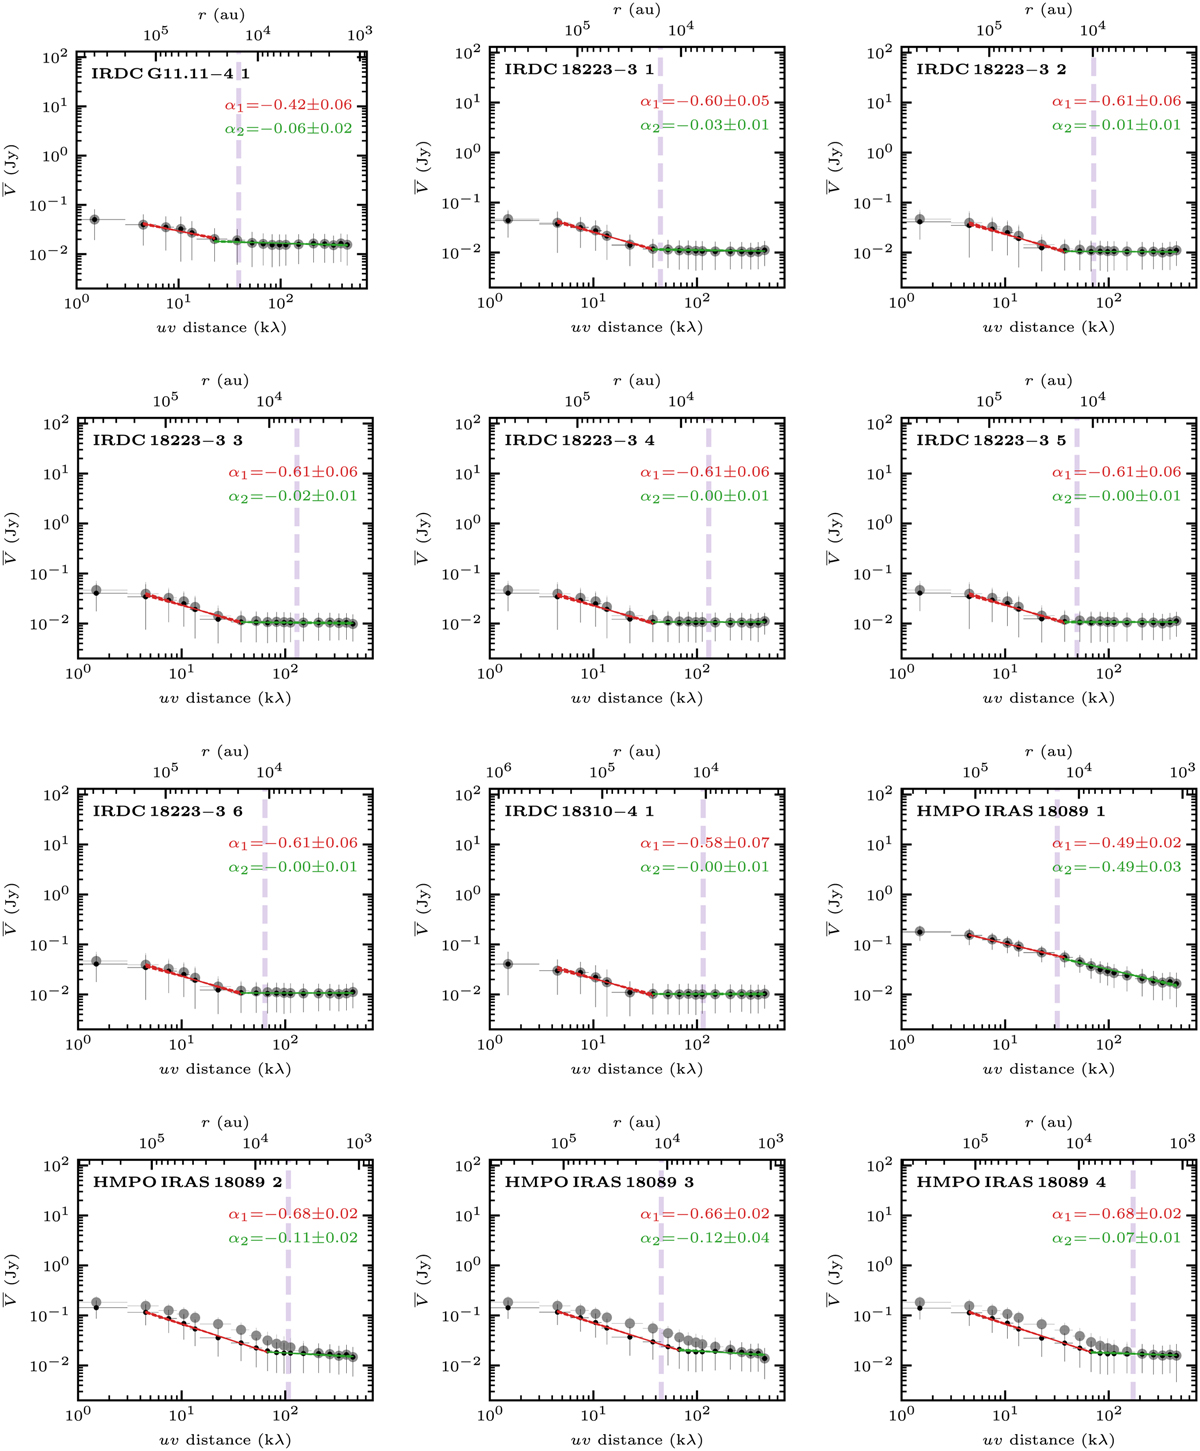
Visibility profiles. The profile of the non-core-subtracted and core-subtracted data is shown in gray and black, respectively (further explained in Sect. 6.1). Two power-law profiles, tracing the clump and core scales, are fitted to the core-subtracted data, shown in red and green, respectively. The bottom axis shows the uv distance in kλ, and the top axis is the corresponding spatial scale. The dashed purple line indicates the diameter of the sources (Table C.1). The visibility profile of dust+ff core 2 in HMC G9.62+.19 is shown in Fig. 7.
Current usage metrics show cumulative count of Article Views (full-text article views including HTML views, PDF and ePub downloads, according to the available data) and Abstracts Views on Vision4Press platform.
Data correspond to usage on the plateform after 2015. The current usage metrics is available 48-96 hours after online publication and is updated daily on week days.
Initial download of the metrics may take a while.