Fig. C.1
Download original image
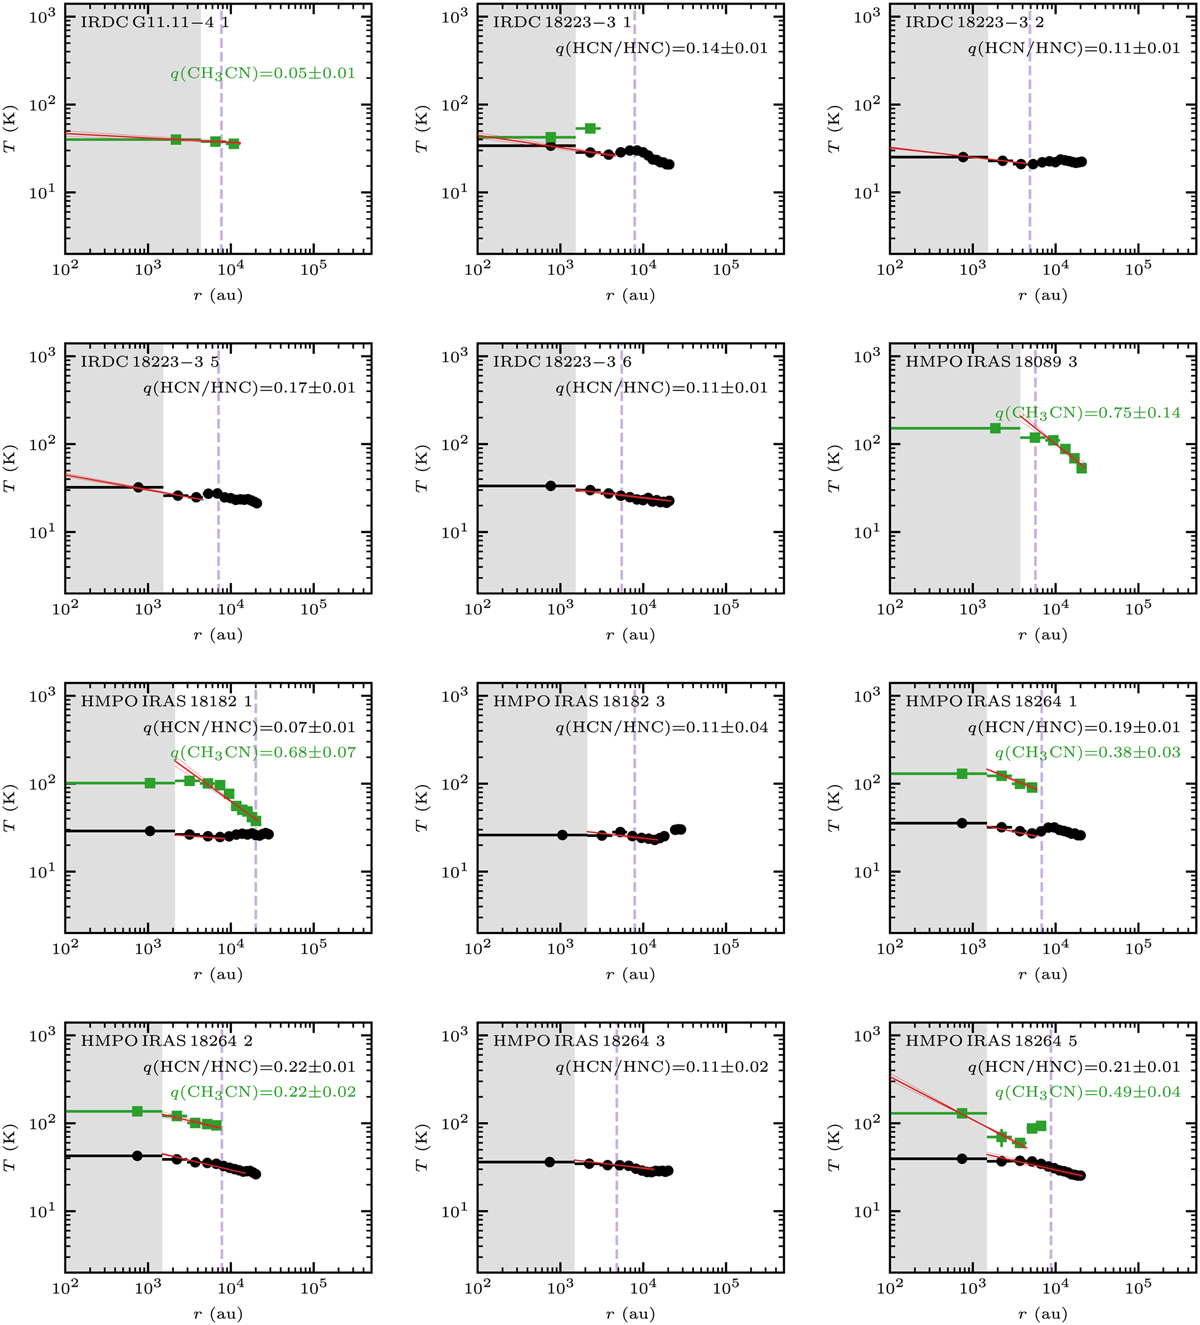
Radial temperature profiles. The profiles extracted from the HCN-to-HNC intensity ratio (Fig. 3), CH3CN (Fig. 4), and ![]() (Fig. 5) temperature maps are shown by black circles, green squares, and blue diamonds, respectively. The inner unresolved region (one beam radius) is shown as a gray-shaded area. The vertical dashed purple line indicates the outer radius, rout, of the continuum (Table C.1). A power-law fit and its 1σ uncertainty to resolved and radially decreasing profiles are shown by the solid and dashed red lines, respectively (Sect. 5.3). The radial temperature profile of dust core 1 in HMPO IRAS 18089 is shown in Fig. 6.
(Fig. 5) temperature maps are shown by black circles, green squares, and blue diamonds, respectively. The inner unresolved region (one beam radius) is shown as a gray-shaded area. The vertical dashed purple line indicates the outer radius, rout, of the continuum (Table C.1). A power-law fit and its 1σ uncertainty to resolved and radially decreasing profiles are shown by the solid and dashed red lines, respectively (Sect. 5.3). The radial temperature profile of dust core 1 in HMPO IRAS 18089 is shown in Fig. 6.
Current usage metrics show cumulative count of Article Views (full-text article views including HTML views, PDF and ePub downloads, according to the available data) and Abstracts Views on Vision4Press platform.
Data correspond to usage on the plateform after 2015. The current usage metrics is available 48-96 hours after online publication and is updated daily on week days.
Initial download of the metrics may take a while.