Fig. 10
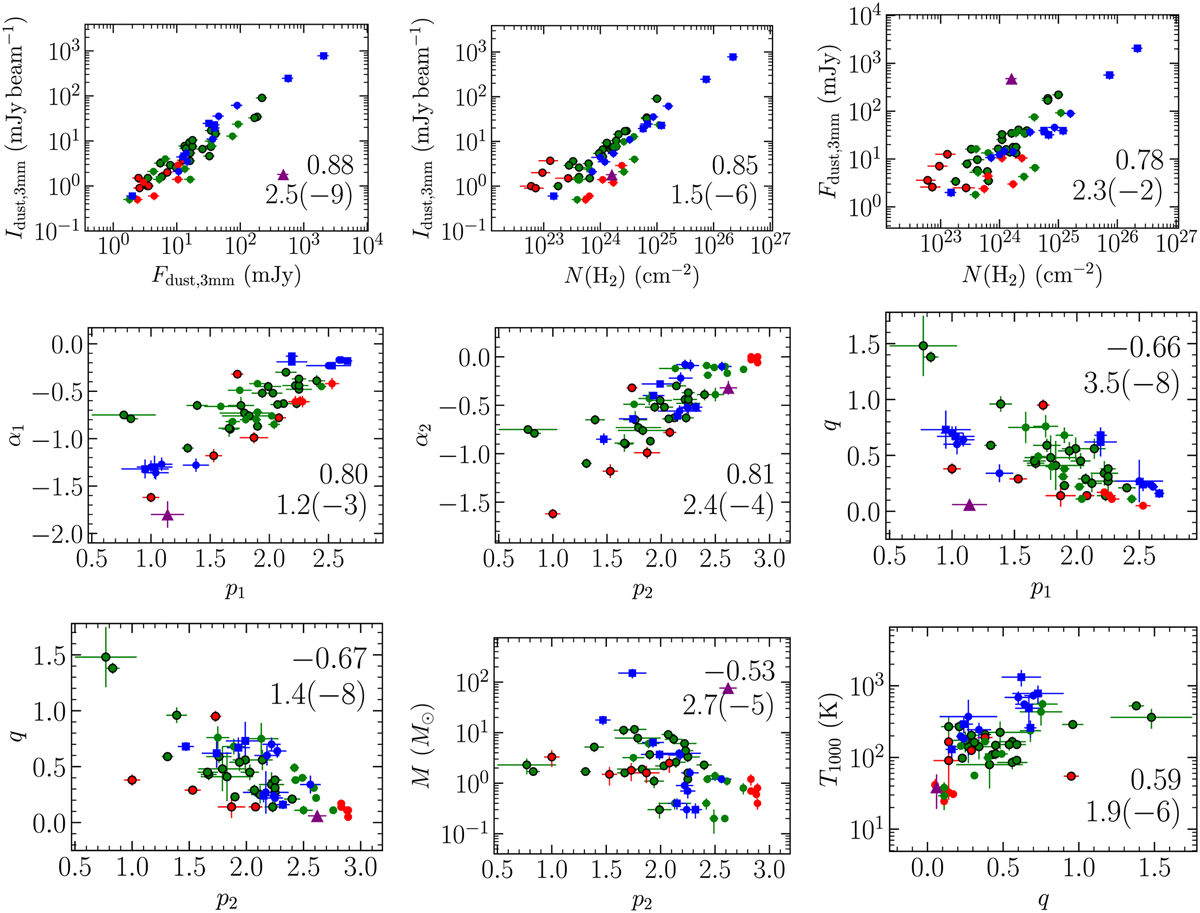
Download original image
Correlations with |rS| > 0.5 of the physical parameters of the ALMA, CORE, and CORE-extension sample. The color of the data points highlights the four evolutionary stages: IRDC (red), HMPO (green), HMC (blue), and UCHII region (purple). The data points of the cores of the CORE (green) and CORE-extension (red) sample are enclosed in black rings. The dust cores, dust+ff cores, and cometary UCHII regions are shown by circles, squares, and triangles, respectively. The Spearman correlation coefficient (rS) and the p-value, with a(b) meaning α × 10b, are shown in each panel.
Current usage metrics show cumulative count of Article Views (full-text article views including HTML views, PDF and ePub downloads, according to the available data) and Abstracts Views on Vision4Press platform.
Data correspond to usage on the plateform after 2015. The current usage metrics is available 48-96 hours after online publication and is updated daily on week days.
Initial download of the metrics may take a while.