Fig. 1
Download original image
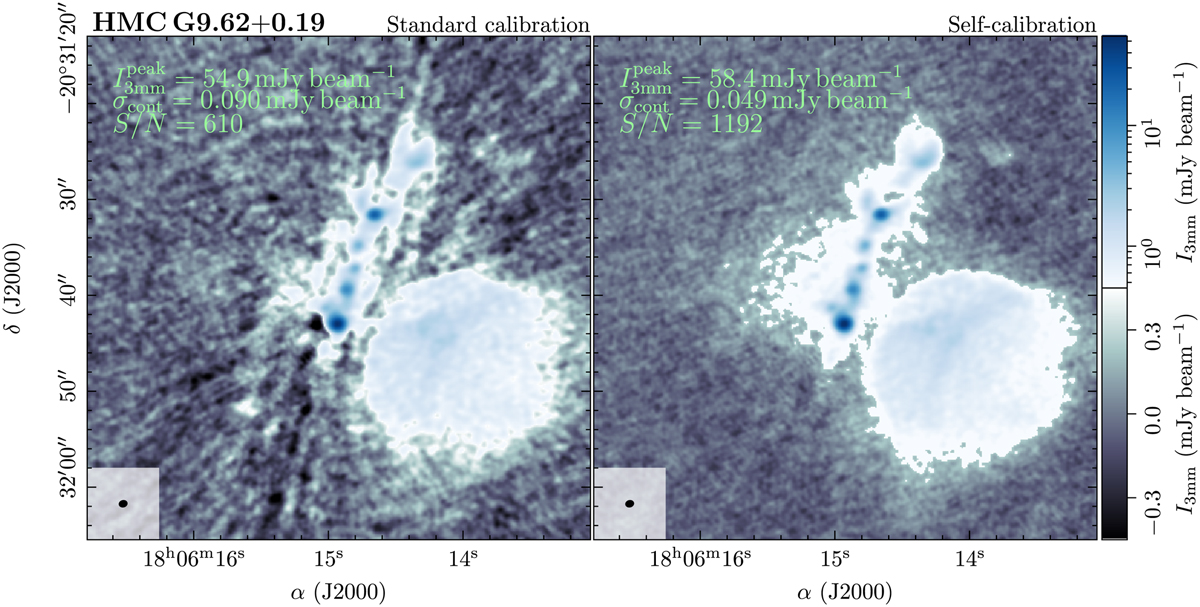
Comparison of CASA standard-calibrated (left panel) and CASA self-calibrated (right panel) HMCG9.62+0.19 ALMA continuum data. In each panel, the beam size is shown in the bottom-left corner. The linear gray-scale and logarithmic blue-scale color map highlight the continuum intensity between −5σcont to +5σcort and between +5σcont and the peak intensity of the standard calibrated data, respectively.
Current usage metrics show cumulative count of Article Views (full-text article views including HTML views, PDF and ePub downloads, according to the available data) and Abstracts Views on Vision4Press platform.
Data correspond to usage on the plateform after 2015. The current usage metrics is available 48-96 hours after online publication and is updated daily on week days.
Initial download of the metrics may take a while.