Open Access
Fig. 6.
Download original image
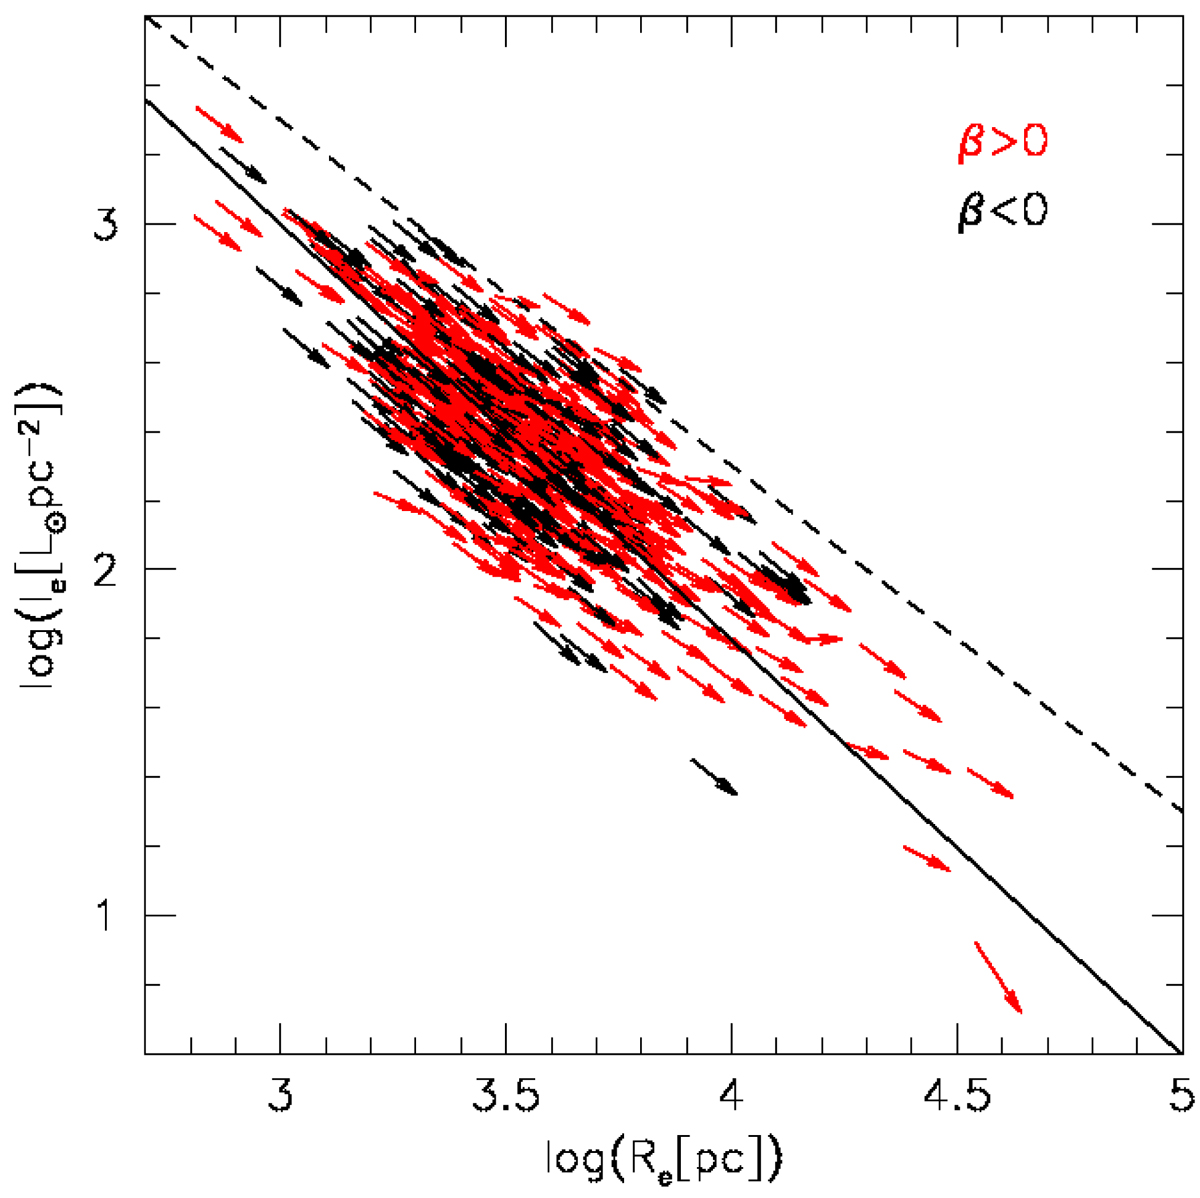
Ie − Re plane. The black and red arrows show the direction of motion of galaxies in this plane for large negative and positive values of β. The black solid line gives the least-squares fit of the data, while the broken line represents the zone of exclusion.
Current usage metrics show cumulative count of Article Views (full-text article views including HTML views, PDF and ePub downloads, according to the available data) and Abstracts Views on Vision4Press platform.
Data correspond to usage on the plateform after 2015. The current usage metrics is available 48-96 hours after online publication and is updated daily on week days.
Initial download of the metrics may take a while.