Fig. 30.
Download original image
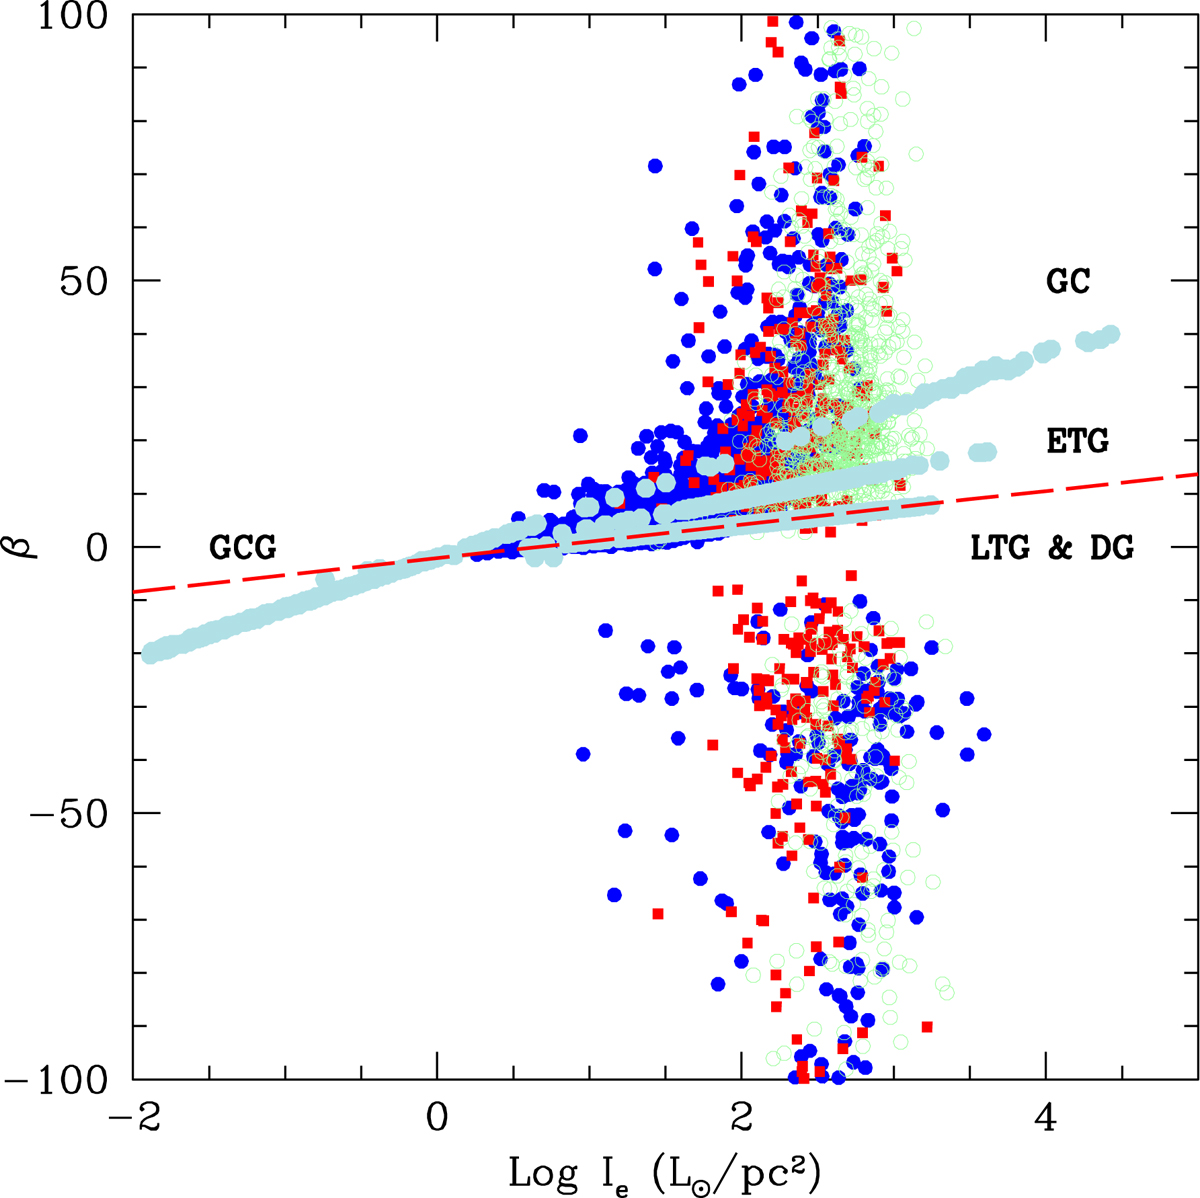
Data and theoretical models for the β − IeV plane. Data from the different sources are plotted: (i) Burstein et al. (1997, light blue). Three sequences are seen: GCGs and GCs, ETGs (no evidence of star formation), LTGs and DGs (evidence of ongoing star formation). By construction, these data are well behaved with no evidence of dispersion. (ii) WINGS data (red squares) showing large dispersion in both coordinates, log Ie is always positive, and β can be very large both positive and negative. (iii) ETGs of Bernardi et al. (2010, open green circles), but limited to z ≤ 0.02. The Illustris-1 model galaxies are indicated by the blue dots; their distribution closely mimics that of the observational data. Finally, the long dashed red line shows the present-day position on the β − Ie plane of our models for the reference case (with τ = 1 Gyr, zf = 10, and no galactic winds). This line coincides with the lower border of the Illustris-1 distribution in the β > 0 hemi-plane.
Current usage metrics show cumulative count of Article Views (full-text article views including HTML views, PDF and ePub downloads, according to the available data) and Abstracts Views on Vision4Press platform.
Data correspond to usage on the plateform after 2015. The current usage metrics is available 48-96 hours after online publication and is updated daily on week days.
Initial download of the metrics may take a while.