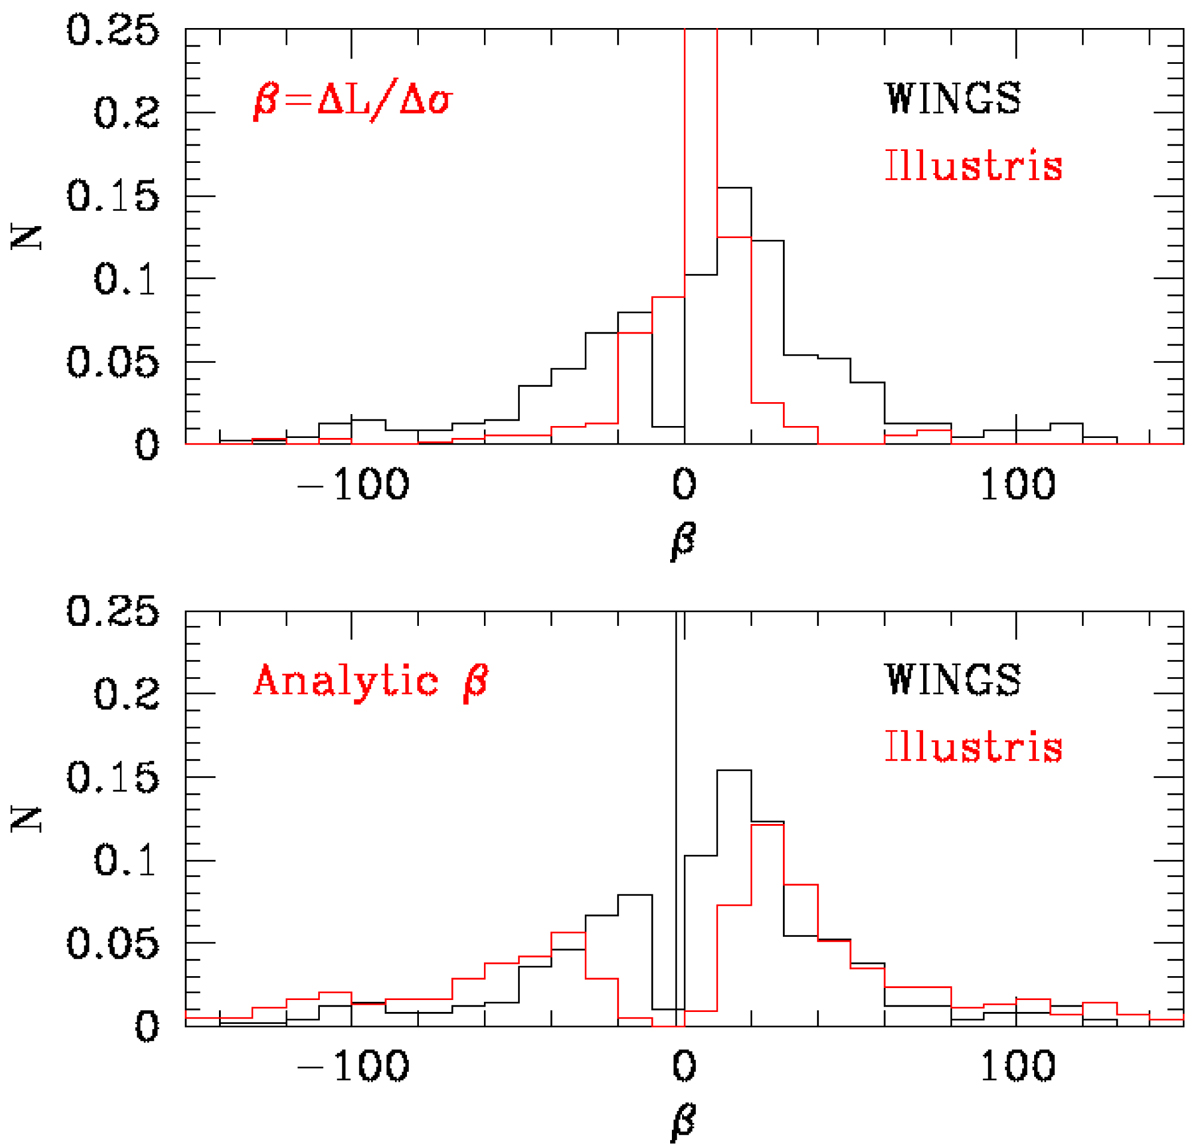
Fig. 3.
Download original image
The distribution of the β parameter. Upper panel: histogram of the β solutions derived from Eq. (14) for the real ETGs (black line) compared with the distribution derived for the galaxies of the Illustris-1 simulation when β is calculated looking at the variation in luminosity and velocity dispersion in two close redshift epochs (z = 0.2 and z = 0). Lower panel: histogram of the β solutions derived from Eq. (14) for the real ETGs (black line) and the Illustris-1 galaxies (red line) that are close to the virial equilibrium. The solid black line gives the average value of β.
Current usage metrics show cumulative count of Article Views (full-text article views including HTML views, PDF and ePub downloads, according to the available data) and Abstracts Views on Vision4Press platform.
Data correspond to usage on the plateform after 2015. The current usage metrics is available 48-96 hours after online publication and is updated daily on week days.
Initial download of the metrics may take a while.