Fig. 29.
Download original image
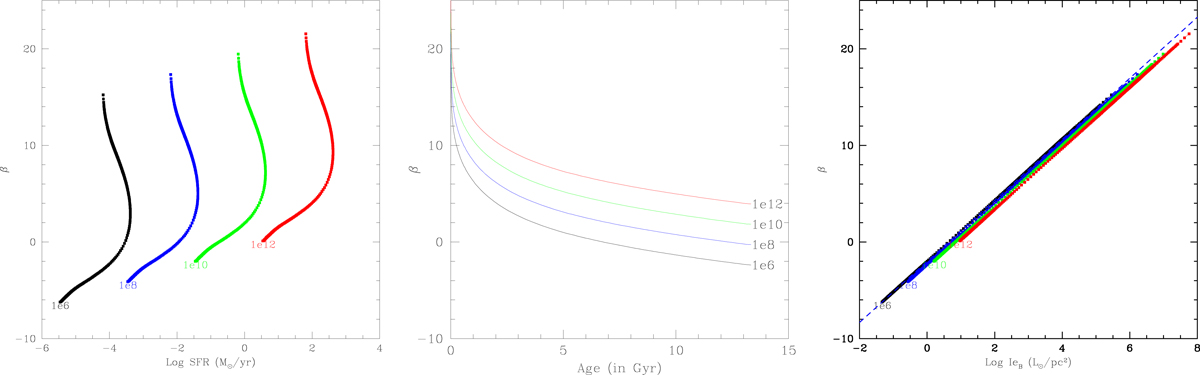
Correlations of β with SFR, Age and Ie. Left panel: relationship between β and SFR. Each curve labeled MB(TG) is identified according to the color-coding adopted in the previous figures. The total baryonic mass is the homology parameter separating each curve from the others. More similar trends are found for the luminosity LB and LV, and for the velocity dispersion σ, which are not shown here for the sake of brevity. In all three relations β mirrors the behavior of the SFR, the luminosity in turn, and finally the velocity dispersion. The SFR is in M⊙ yr−1. Middle panel: relationship between β and age (in Gyr). Symbols and color-coding have the same meaning as in the left panel. Right panel: relationship between β and IeB in L⊙ pc−2. The lines corresponding to different masses of galaxies have been shifted by 0.1; they collapse to a unique curve given by β = 3.159Log(IeB)−2.003. The long dashed line is the best fit of the theoretical data. An identical relation can be found for IeV with the same slope but slightly different zero point.
Current usage metrics show cumulative count of Article Views (full-text article views including HTML views, PDF and ePub downloads, according to the available data) and Abstracts Views on Vision4Press platform.
Data correspond to usage on the plateform after 2015. The current usage metrics is available 48-96 hours after online publication and is updated daily on week days.
Initial download of the metrics may take a while.