Fig. 25.
Download original image
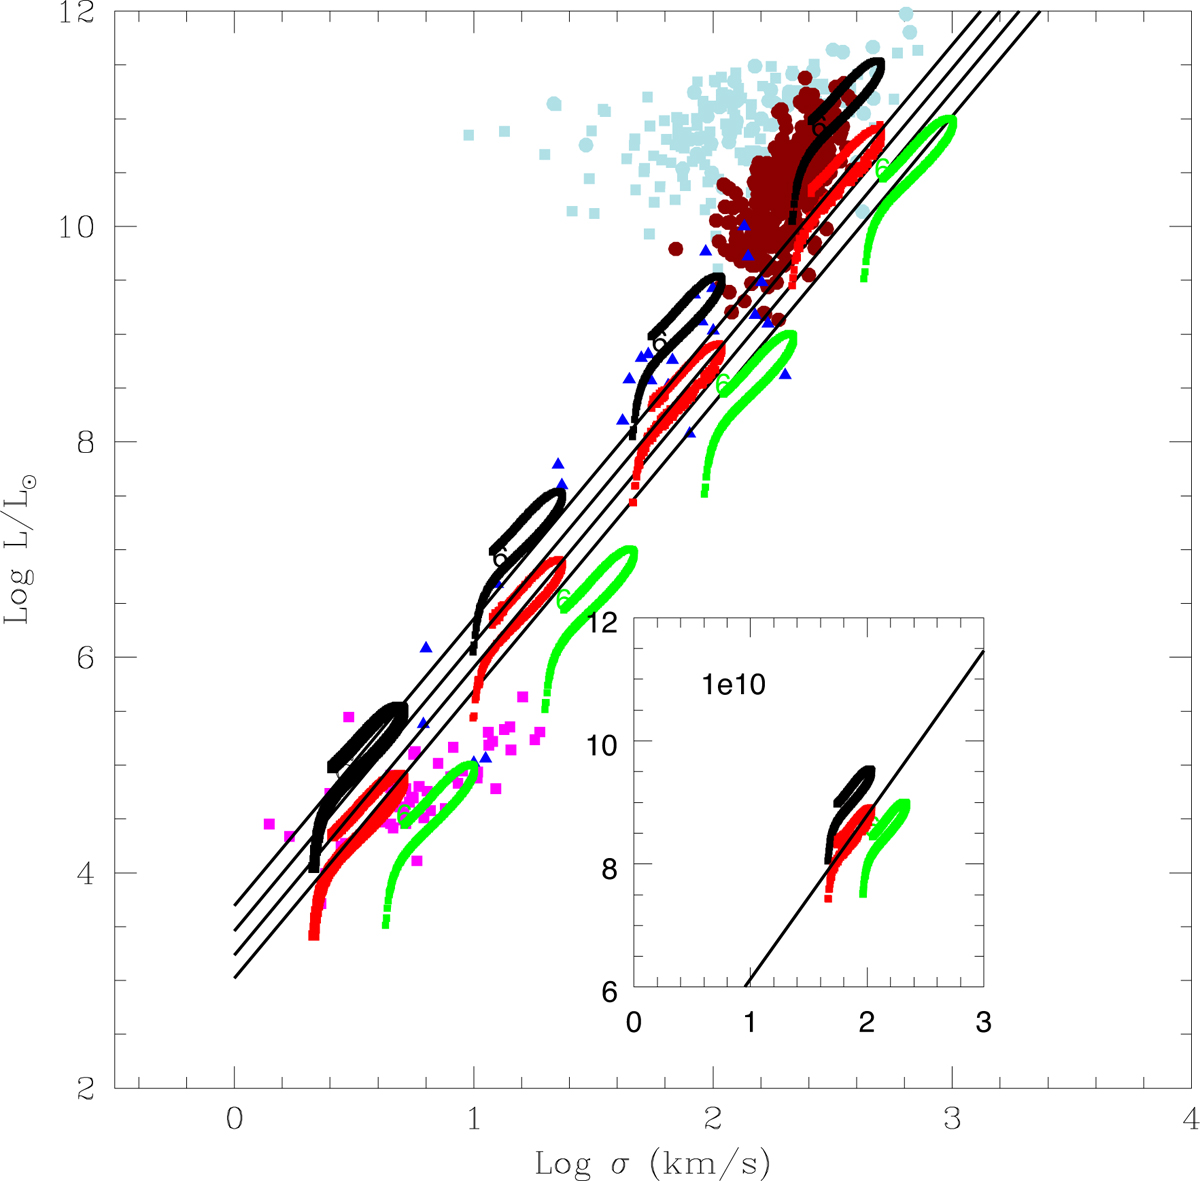
Luminosity LB/L⊙ vs. velocity dispersion σ (in km s−1) relation of our model galaxies. For each mass (labeled MB(tG), as indicated) three relations are shown: (1) original models with no revision of the radii (lines made of filled black squares); (2) models whose luminosity is derived from the ![]() relation with the original β and
relation with the original β and ![]() (curves made of red squares) together with the linear fit limited to the descending branch of each curve (black solid lines); (3) models in which the radii have been revised and new values of β and
(curves made of red squares) together with the linear fit limited to the descending branch of each curve (black solid lines); (3) models in which the radii have been revised and new values of β and ![]() are calculated (green curves). In each case the luminosity–sigma relation bends past the stage that roughly corresponds to the maximum stellar activity. From this stage the luminosity and velocity dispersion decrease (see text for details). The inset shows the case of MB(tG) = 1010 M⊙ for the sake of clarity. The models are compared with the data by Burstein et al. (1997) from GCs to GCGs; the same color-coding as in the previous figures is used.
are calculated (green curves). In each case the luminosity–sigma relation bends past the stage that roughly corresponds to the maximum stellar activity. From this stage the luminosity and velocity dispersion decrease (see text for details). The inset shows the case of MB(tG) = 1010 M⊙ for the sake of clarity. The models are compared with the data by Burstein et al. (1997) from GCs to GCGs; the same color-coding as in the previous figures is used.
Current usage metrics show cumulative count of Article Views (full-text article views including HTML views, PDF and ePub downloads, according to the available data) and Abstracts Views on Vision4Press platform.
Data correspond to usage on the plateform after 2015. The current usage metrics is available 48-96 hours after online publication and is updated daily on week days.
Initial download of the metrics may take a while.