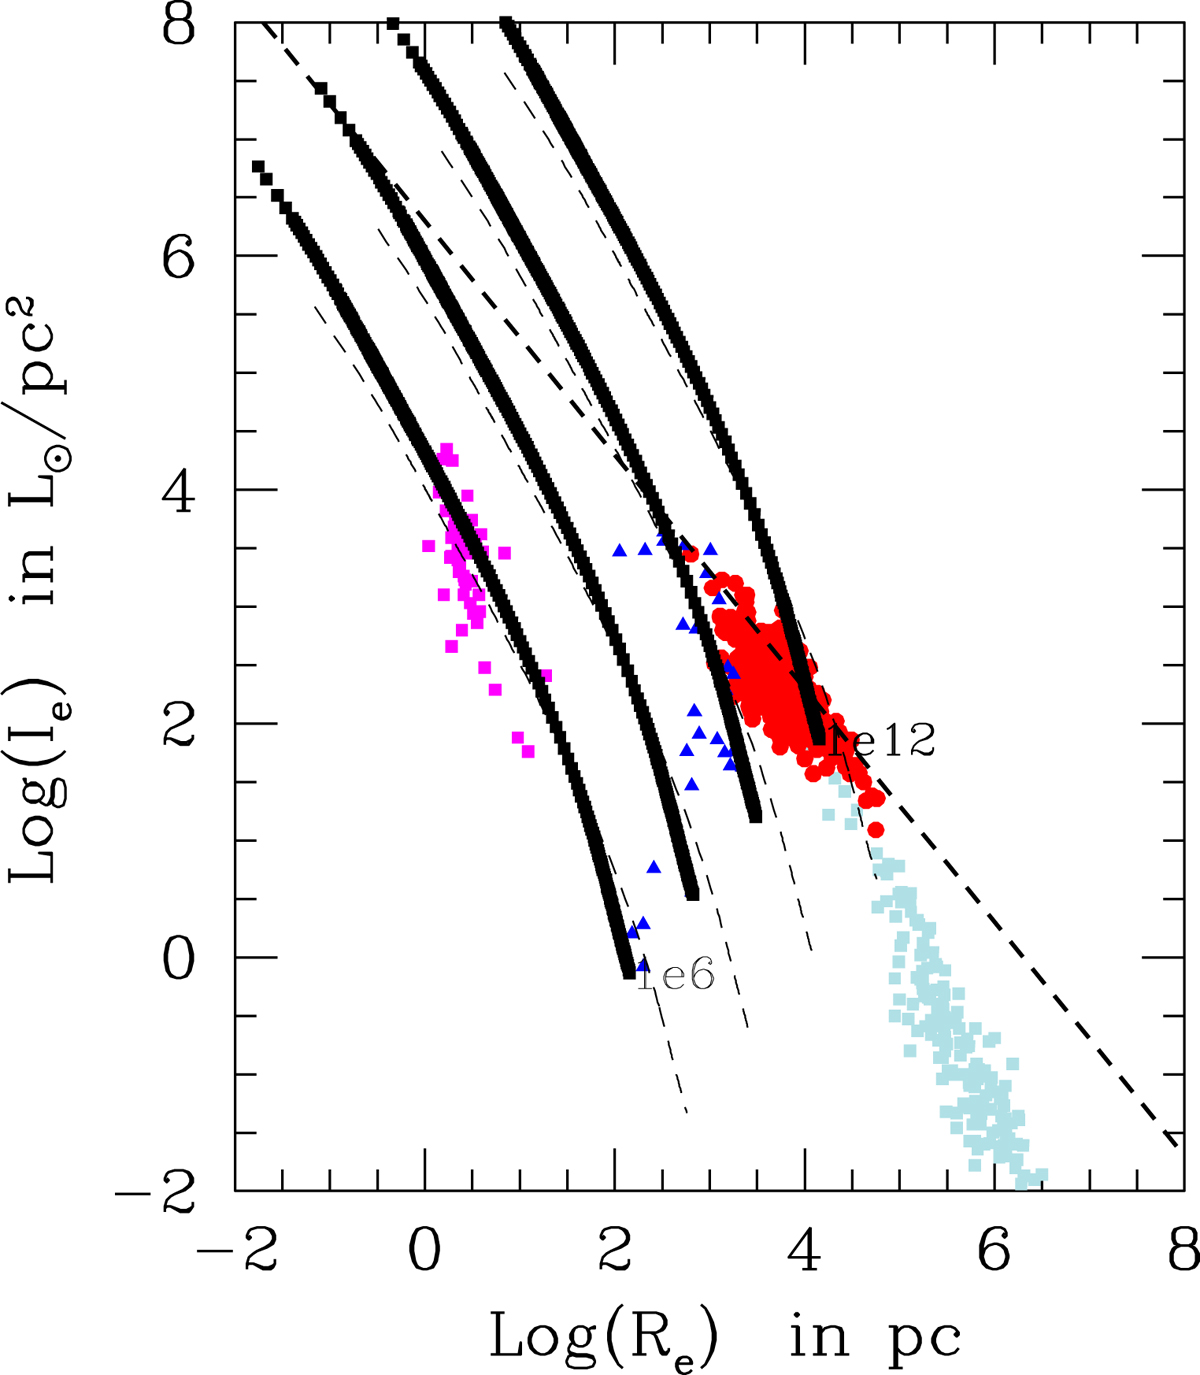
Fig. 23.
Download original image
Ie − Re plane of our model galaxies compared with the observational data of Burstein et al. (1997). The color-coding of the data is the same as in previous figures. There are two groups of models. The black thin dashed lines are models with original radii, while the thick lines made of filled black squares are those with the radius decreased by a factor of 4 and the specific intensity Ie increased by a factor of 16. The galaxy mass is MB(TG) equal to 106, 108, 1010, and 1012 M⊙ (from left to right). Along each line the time runs from zero to present age (from top to bottom). The formation redshift of all the models is zfor = 10.
Current usage metrics show cumulative count of Article Views (full-text article views including HTML views, PDF and ePub downloads, according to the available data) and Abstracts Views on Vision4Press platform.
Data correspond to usage on the plateform after 2015. The current usage metrics is available 48-96 hours after online publication and is updated daily on week days.
Initial download of the metrics may take a while.