Fig. 19.
Download original image
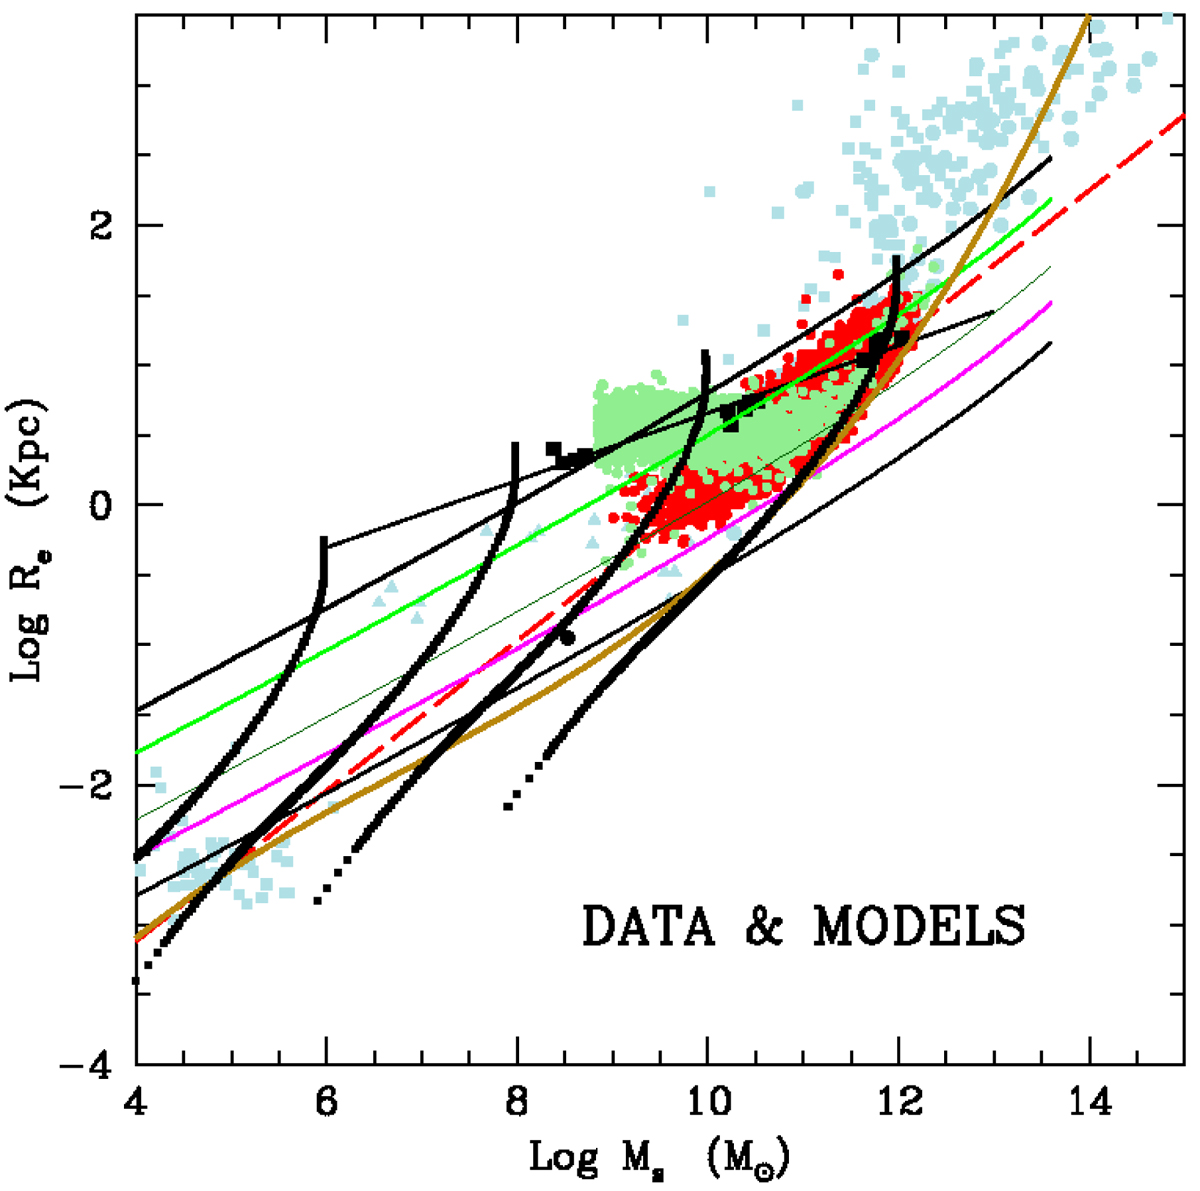
Mass-radius relations (MRRs) of our model galaxies labeled by their present-day total baryonic mass MB(TG) equal to 106, 108, 1010, and 1012 M⊙ (from left to right). Each line made of filled black squares represents the whole evolutionary history of Ms and Re, both increasing with time (present-day at the top). These models are compared both with observational and theoretical data from different sources: (i) the observational data of Burstein et al. (1997) from GCs to GCGs (light blue dots) and the ETGs by Bernardi et al. (2010, red dots); (ii) the Illustris-1 galaxies (light green dots); (iii) the low initial density models (blue squares and their best fit) and the high initial density models (red squares and their best fit) by Chiosi & Carraro (2002; iv) the early hierarchical models by Merlin et al. (2012, black squares and their best fit); (v) the Fan et al. (2010) MRRs for different values of the formation redshift (from top to bottom) zf = 0, 1, 5, 10, and 20; and (vi) the MRR by Chiosi et al. (2020, dark yellow line). See the text for more details.
Current usage metrics show cumulative count of Article Views (full-text article views including HTML views, PDF and ePub downloads, according to the available data) and Abstracts Views on Vision4Press platform.
Data correspond to usage on the plateform after 2015. The current usage metrics is available 48-96 hours after online publication and is updated daily on week days.
Initial download of the metrics may take a while.