Fig. 1.
Download original image
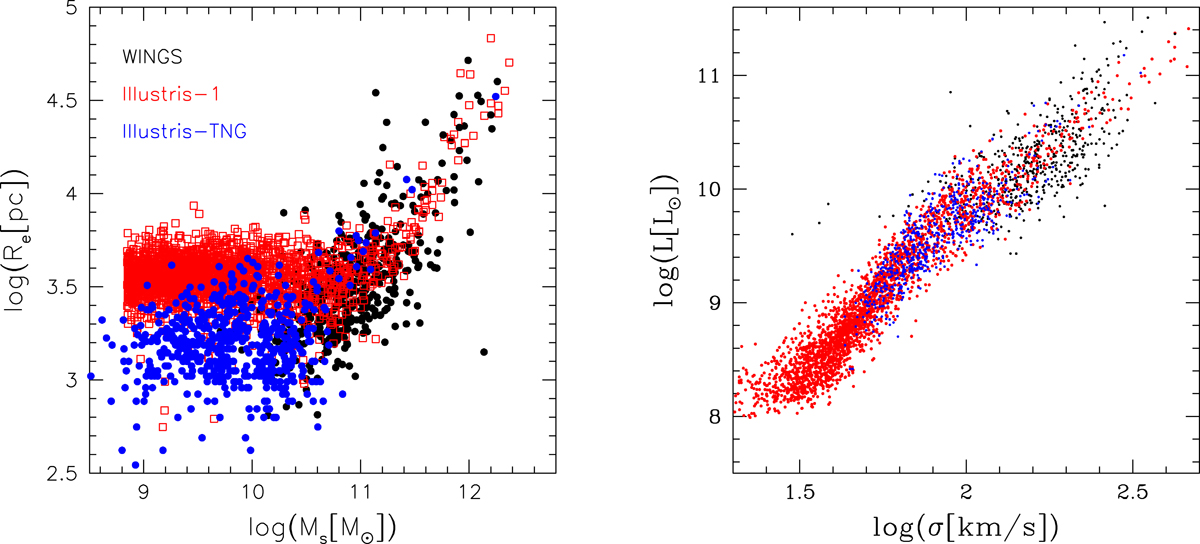
The size-mass and Faber–Jackson relationships. Left panel: stellar mass vs. radius relations for the Illustris-1 (open red squares) and the Illustris-TNG-100 (blue dots) samples at z = 0 and comparison of the models with the WINGS data (black dots). There are 2400 objects for the Illustris-1 sample and about 600 objects for the Illustris-TNG-100. The mean radii of Illustris-1 are smaller by about a factor of two for stellar masses lower than about 6 × 10¹⁰ M⊙, while they are nearly equal (if not slightly larger) above this limit. Right panel: L − σ plane of the same data. The symbols and color-coding are the same as in the left panel.
Current usage metrics show cumulative count of Article Views (full-text article views including HTML views, PDF and ePub downloads, according to the available data) and Abstracts Views on Vision4Press platform.
Data correspond to usage on the plateform after 2015. The current usage metrics is available 48-96 hours after online publication and is updated daily on week days.
Initial download of the metrics may take a while.