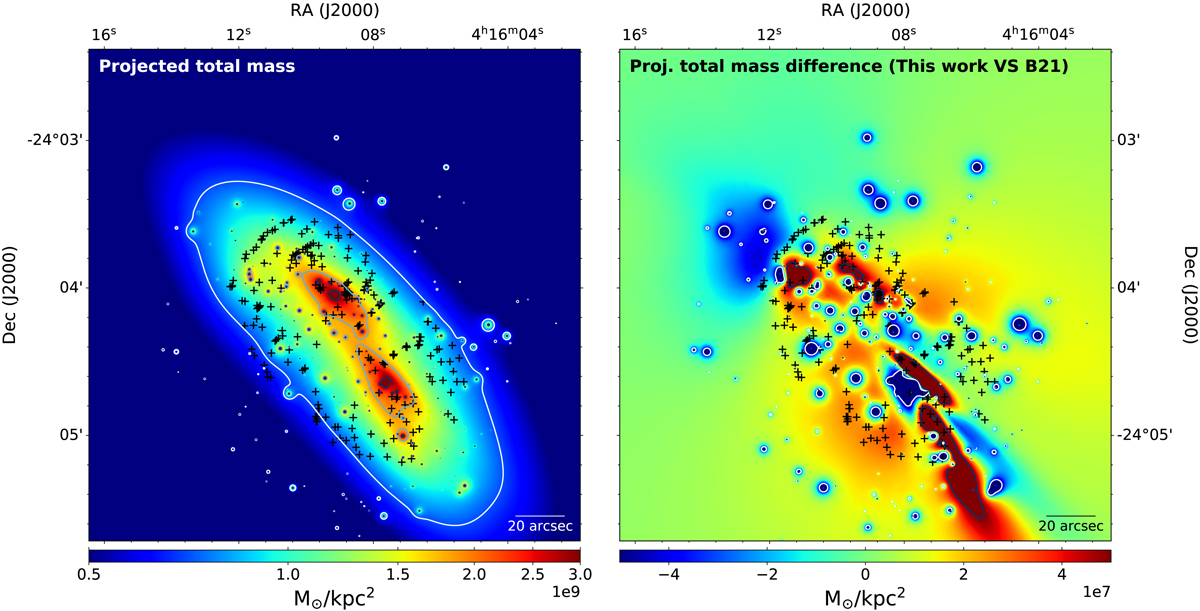
Fig. 5.
Download original image
Projected total mass density distribution of M0416 from the best-fit lens model presented in this work. Left: Projected total mass density distribution of M0416. Contour levels correspond to values of [0.70,1.85,3.00] × 109 M⊙ kpc−2. Right: Difference between the cluster total mass density distributions inferred from the present reference lens model and that by B21. This map is obtained by considering 500 realizations of the lens models randomly extracting samples of free parameter values from the MCMC chains. The procedure adopted to generate this map is detailed in Sect. 4. Contour levels correspond to values of [−5,5] × 107 M⊙ kpc−2 (i.e., the limits of the color bar). The observed positions of the 237 multiple images used as model constraints are shown as black crosses.
Current usage metrics show cumulative count of Article Views (full-text article views including HTML views, PDF and ePub downloads, according to the available data) and Abstracts Views on Vision4Press platform.
Data correspond to usage on the plateform after 2015. The current usage metrics is available 48-96 hours after online publication and is updated daily on week days.
Initial download of the metrics may take a while.