Fig. 6
Download original image
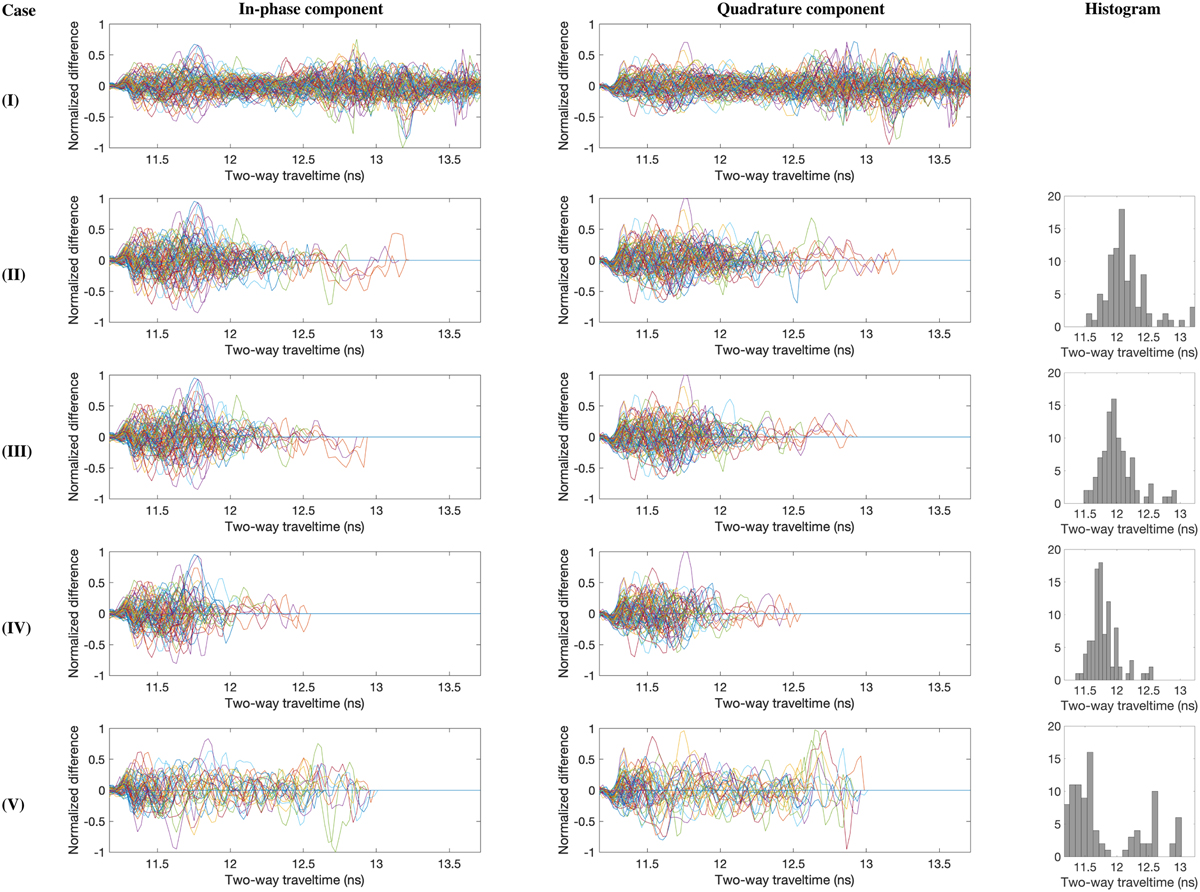
Normalised difference curves of the measured DM and simulated HM data of the 92 measurement points showing the in-phase and quadrature components of the QAM-modulated full-wave data (Case I, top row), the effect of the threshold parameter γ (Cases II–IV, middle rows), and the 80% maximum peak detection filtering (Case V, bottom row). The histograms of the filtered cases show how the distribution of the data changes between the two filtering techniques.
Current usage metrics show cumulative count of Article Views (full-text article views including HTML views, PDF and ePub downloads, according to the available data) and Abstracts Views on Vision4Press platform.
Data correspond to usage on the plateform after 2015. The current usage metrics is available 48-96 hours after online publication and is updated daily on week days.
Initial download of the metrics may take a while.