Fig. 2
Download original image
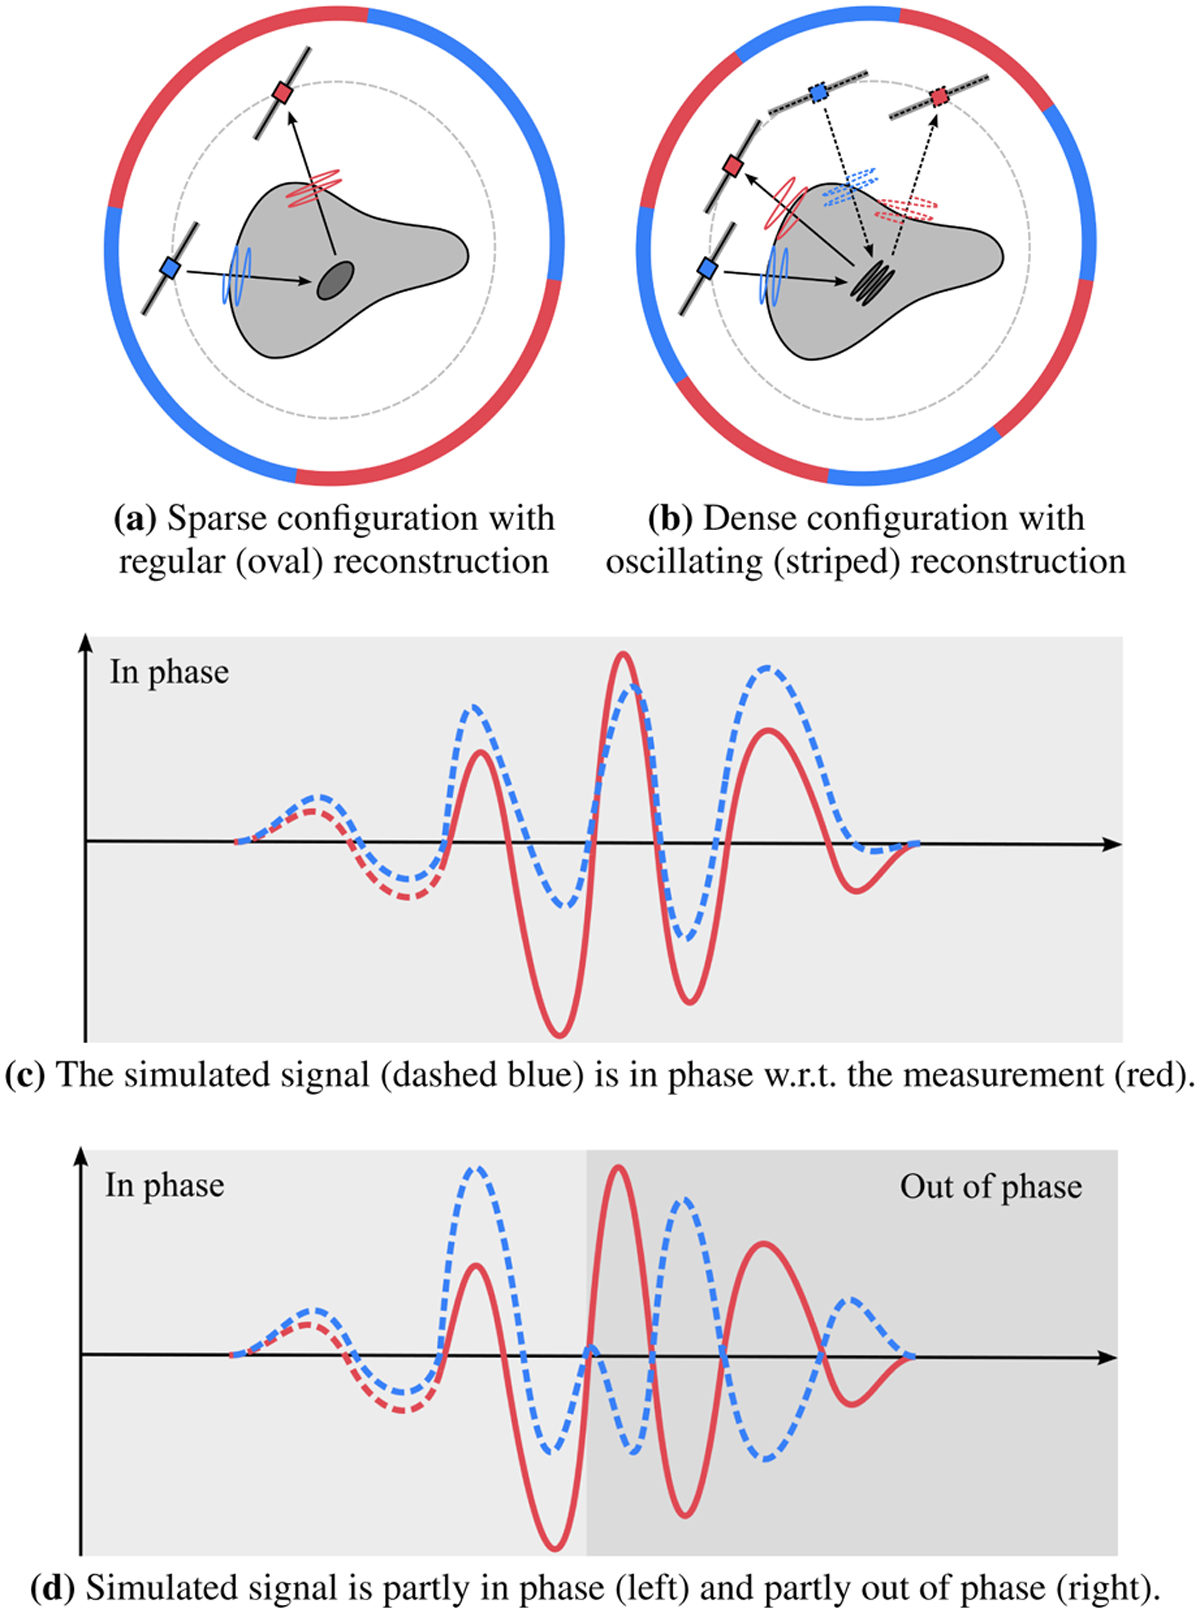
Schematic illustrations on the choice of measurement configuration and phase difference. (a): a single transmitter (blue) and receiver (red) pair orbiting a non-convex asteroid body. (b): two signal paths (solid and dashed), whose difference might be significant with respect to the carrier wavelength and thereby its phase. (c): outline of a demodulated measured signal y (red) and numerically simulated (dashed blue) curve ![]() that is in phase with respect to the measurement. (d): simulated signal partly in phase (left) and partly out of phase (right), while otherwise being similar to the signal. Despite their difference with respect to the phase, the signals in (c) and (d) can correspond to nearby measurement points. Consequently, sparse measurement configurations might be advantageous in reconstructing coarse details (oval in (a)), as incorporating data from multiple measurement points to the reconstruction might introduce artefacts in a reconstructed distribution (Yusuf et al. 2022) when found using the Born approximation of the simulated full-wave signal (striped detail in (b)). The density of the transmitter and measurement points in each configuration is depicted by the sectors of the encircling circle.
that is in phase with respect to the measurement. (d): simulated signal partly in phase (left) and partly out of phase (right), while otherwise being similar to the signal. Despite their difference with respect to the phase, the signals in (c) and (d) can correspond to nearby measurement points. Consequently, sparse measurement configurations might be advantageous in reconstructing coarse details (oval in (a)), as incorporating data from multiple measurement points to the reconstruction might introduce artefacts in a reconstructed distribution (Yusuf et al. 2022) when found using the Born approximation of the simulated full-wave signal (striped detail in (b)). The density of the transmitter and measurement points in each configuration is depicted by the sectors of the encircling circle.
Current usage metrics show cumulative count of Article Views (full-text article views including HTML views, PDF and ePub downloads, according to the available data) and Abstracts Views on Vision4Press platform.
Data correspond to usage on the plateform after 2015. The current usage metrics is available 48-96 hours after online publication and is updated daily on week days.
Initial download of the metrics may take a while.