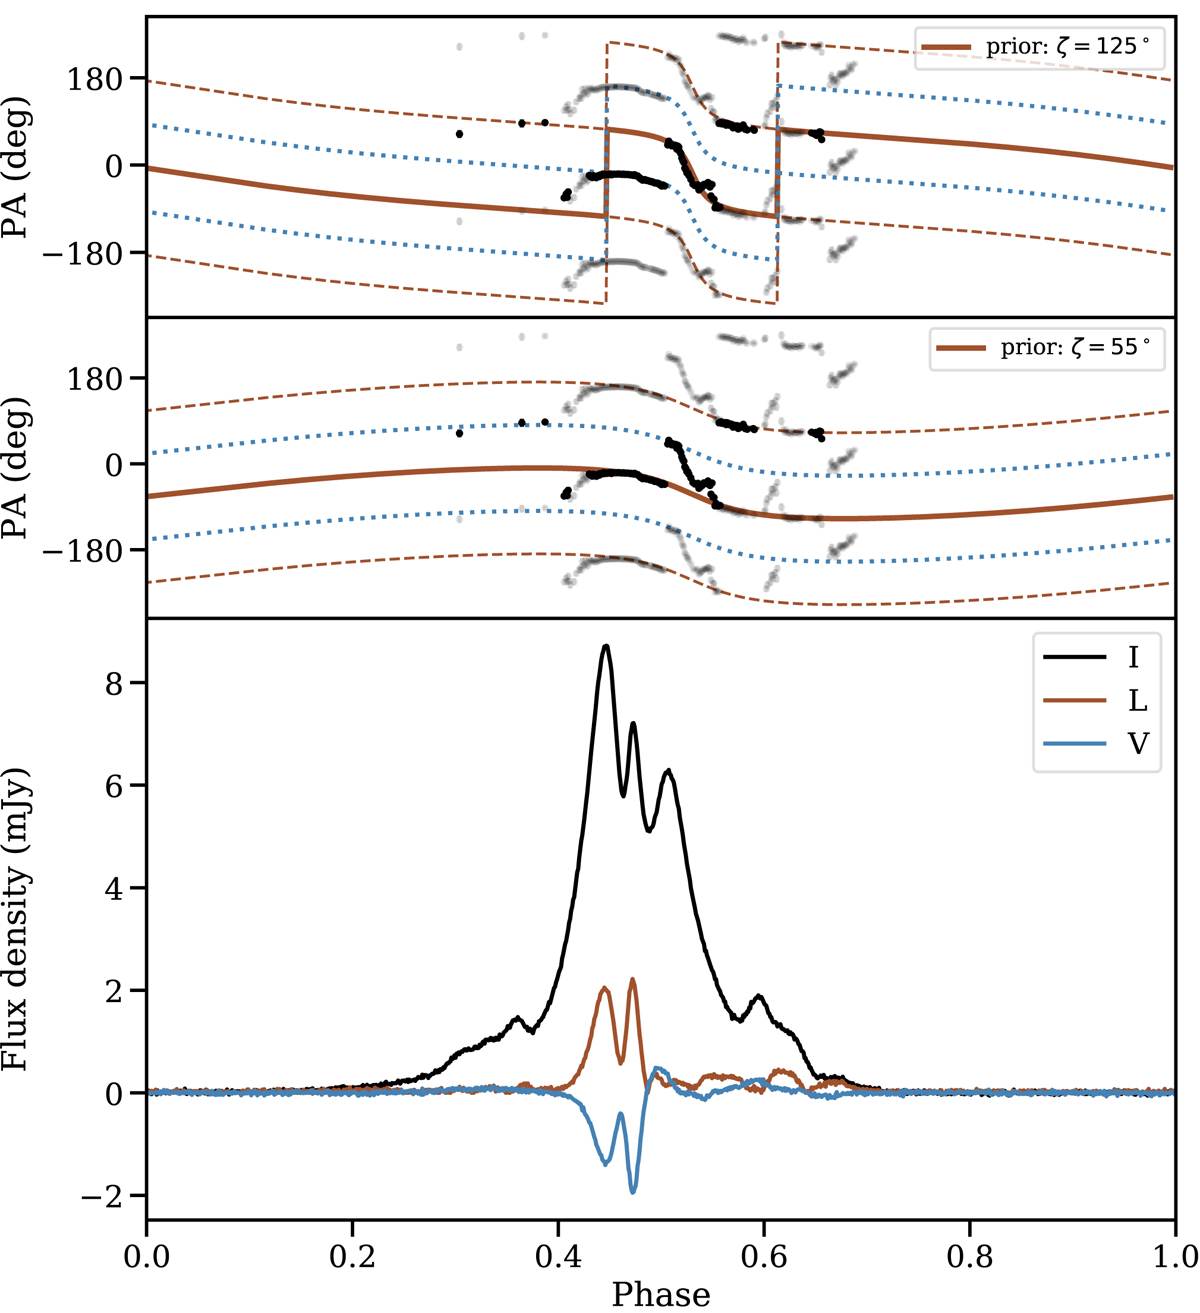
Fig. 1.
Download original image
Averaged flux-calibrated and RM-corrected PSR J1933−6211 pulse profile (bottom) and associated polarisation position angles (middle and top). Bottom: this averaged flux-calibrated and RM-corrected profile was obtained from adding all 24.5 h of MeerKAT L-band data, providing an S/N ≈ 3000, a peak flux density of 8.7 mJy, and a mean flux density of 1.1 mJy. The profile shows significant linear (red, L) and circular (blue, V) polarisation, the sharped-edged features of which make it an ideal candidate for MTM timing techniques when detecting it brightly. Middle and top: the linear polarisation PA are plotted for all phase bins with significant (> 5σ) linear polarisation. To visualise PA swings, we present the PA values, together with PA+180 deg and PA−180 deg (grey data points) in both panels. The solid (brown) line shows the best-fit RVM model when using a prior of ζ = 125 deg and obtaining α = 41.66 (4) deg (top), or a prior of ζ = 55 deg and obtaining α = 121.99 (4) deg (middle) as described in Sect. 3, with their ±180 deg equivalent as dashed (brown) lines. This fit was obtained using only the data points in black and removing the fainter data points of the centrally plotted PA values. The dotted lines (blue) in both panels are PA ± 90 deg to show the potential PA values of orthogonally polarised modes.
Current usage metrics show cumulative count of Article Views (full-text article views including HTML views, PDF and ePub downloads, according to the available data) and Abstracts Views on Vision4Press platform.
Data correspond to usage on the plateform after 2015. The current usage metrics is available 48-96 hours after online publication and is updated daily on week days.
Initial download of the metrics may take a while.