Open Access
Fig. 9.
Download original image
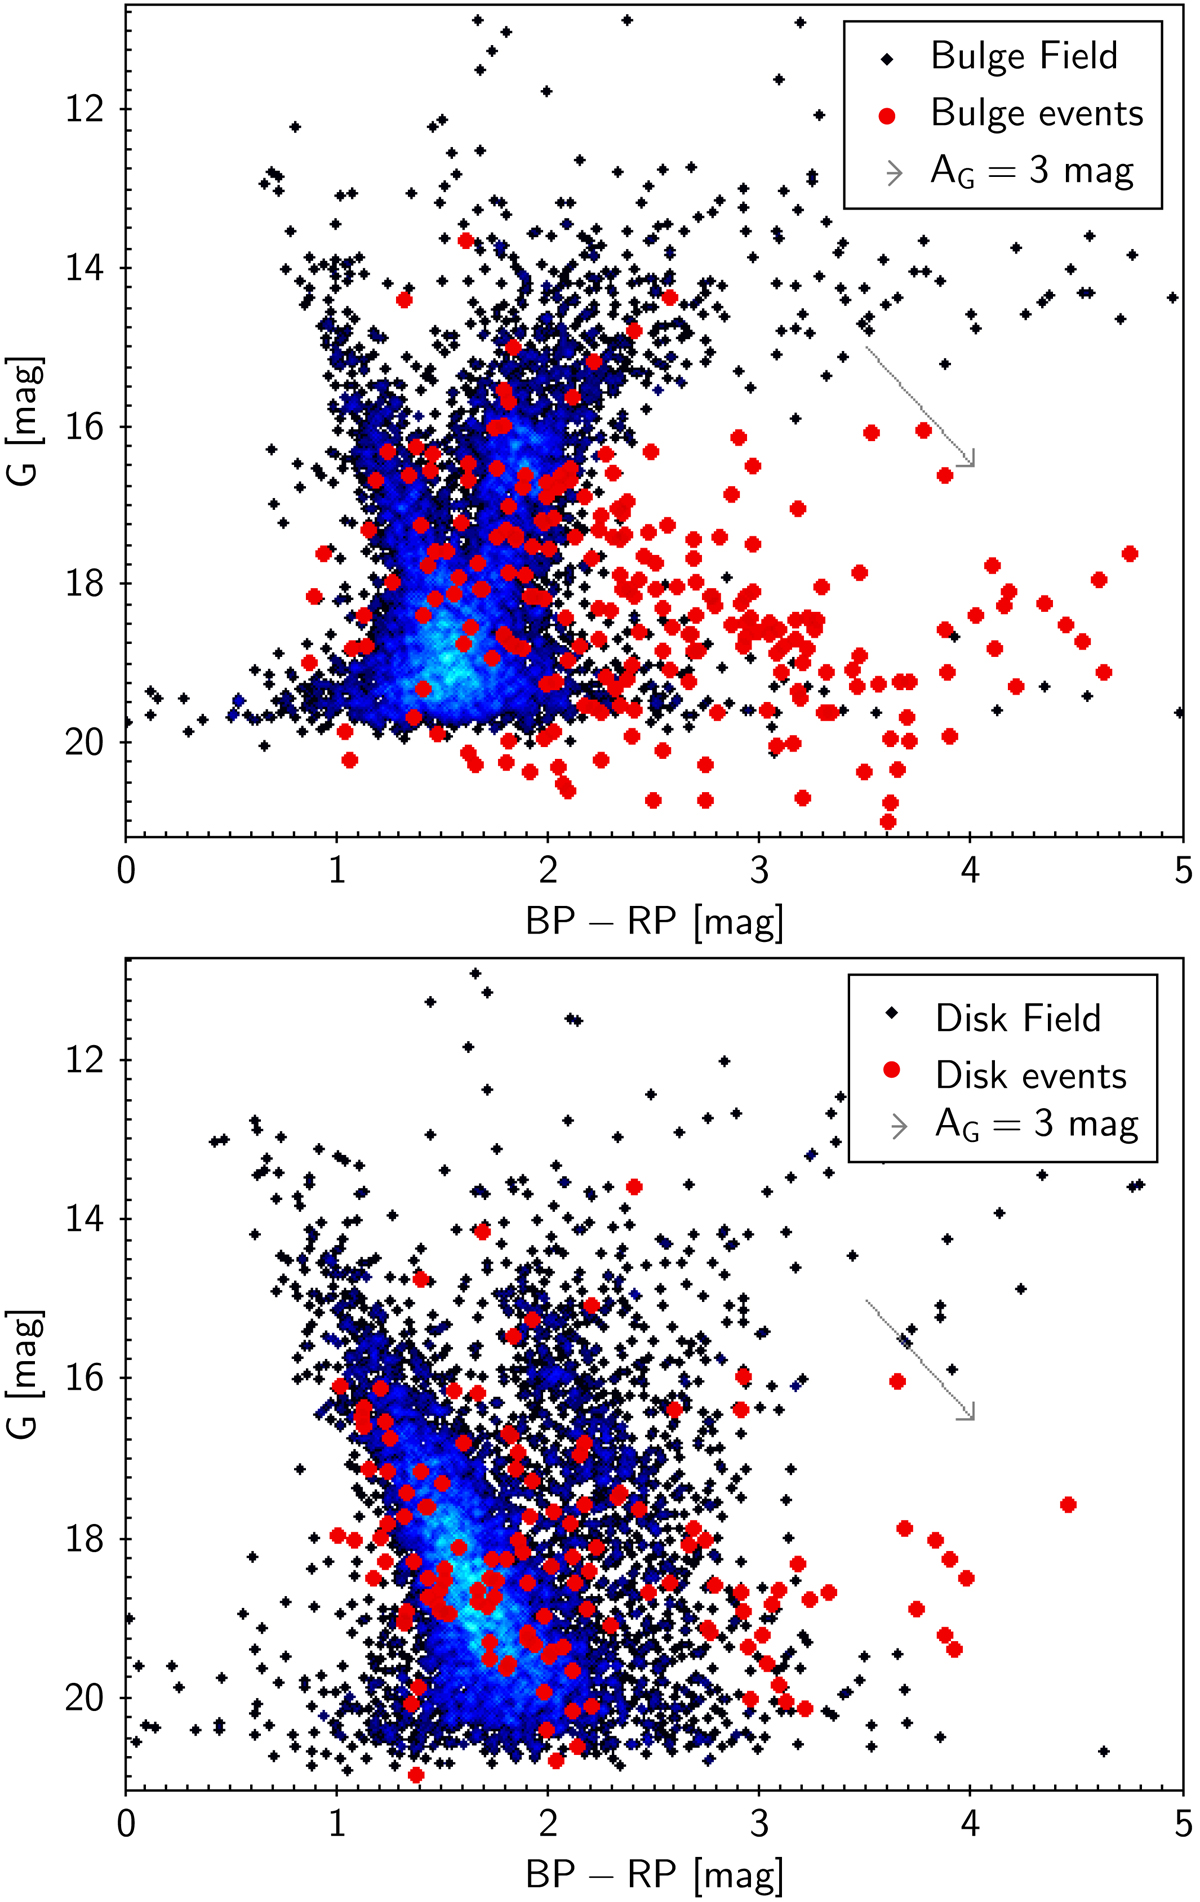
Colour–magnitude diagrams as observed by Gaia (black/blue points) for a typical bulge field (upper panel) and typical disc field (lower panel). The positions of microlensing events are displayed based on their average GBP−GRP colour from Gaia DR3 and their baseline G magnitude from Level 0 fit.
Current usage metrics show cumulative count of Article Views (full-text article views including HTML views, PDF and ePub downloads, according to the available data) and Abstracts Views on Vision4Press platform.
Data correspond to usage on the plateform after 2015. The current usage metrics is available 48-96 hours after online publication and is updated daily on week days.
Initial download of the metrics may take a while.