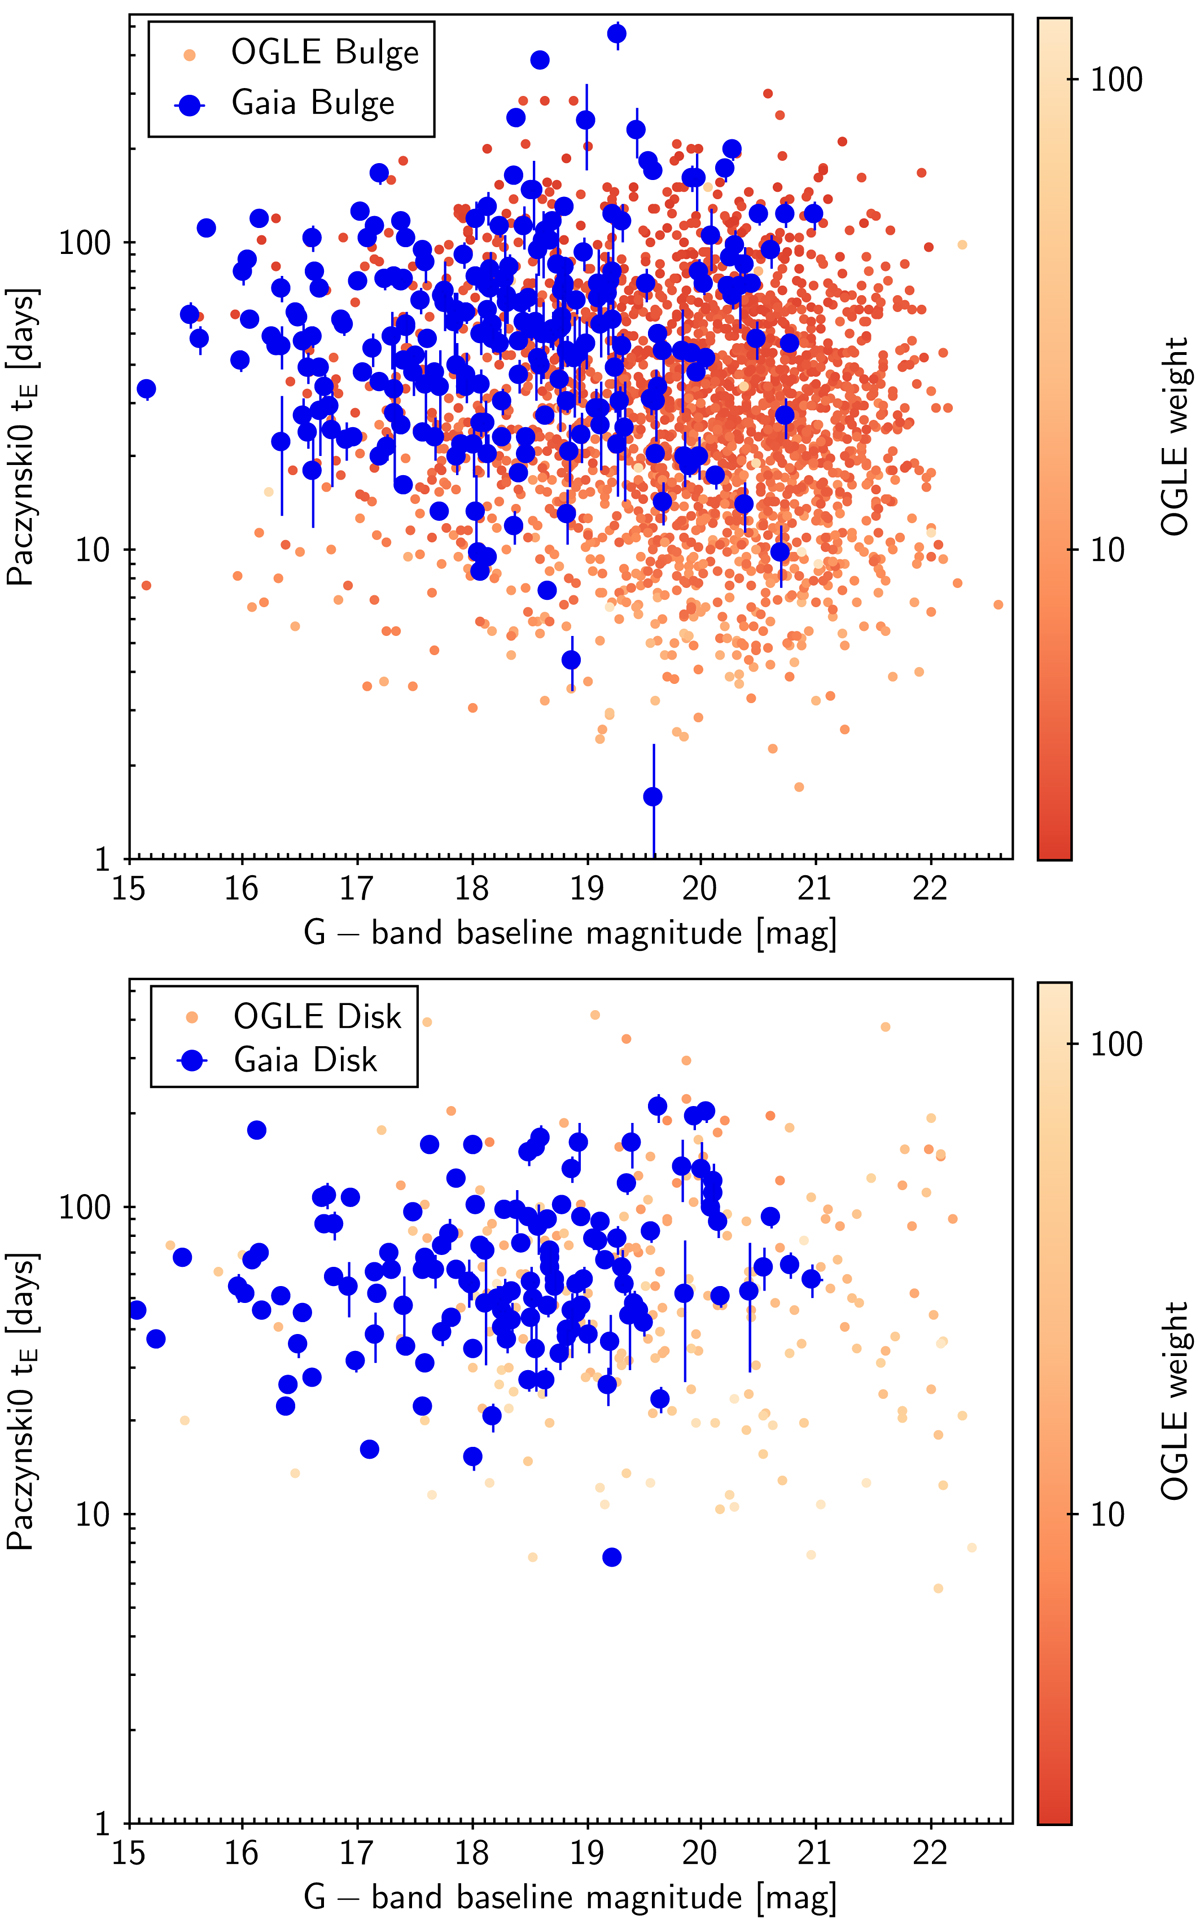
Fig. 13.
Download original image
Comparison of Gaia event timescales and baseline magnitudes with OGLE-IV events for the bulge (top) and disc (bottom) samples. Colour shading for OGLE points indicates the weight, which reflects the detection efficiency of the OGLE survey (Mróz et al. 2019, 2020b). Only OGLE events that occurred during the DR3 time range are shown.
Current usage metrics show cumulative count of Article Views (full-text article views including HTML views, PDF and ePub downloads, according to the available data) and Abstracts Views on Vision4Press platform.
Data correspond to usage on the plateform after 2015. The current usage metrics is available 48-96 hours after online publication and is updated daily on week days.
Initial download of the metrics may take a while.