Fig. 10.
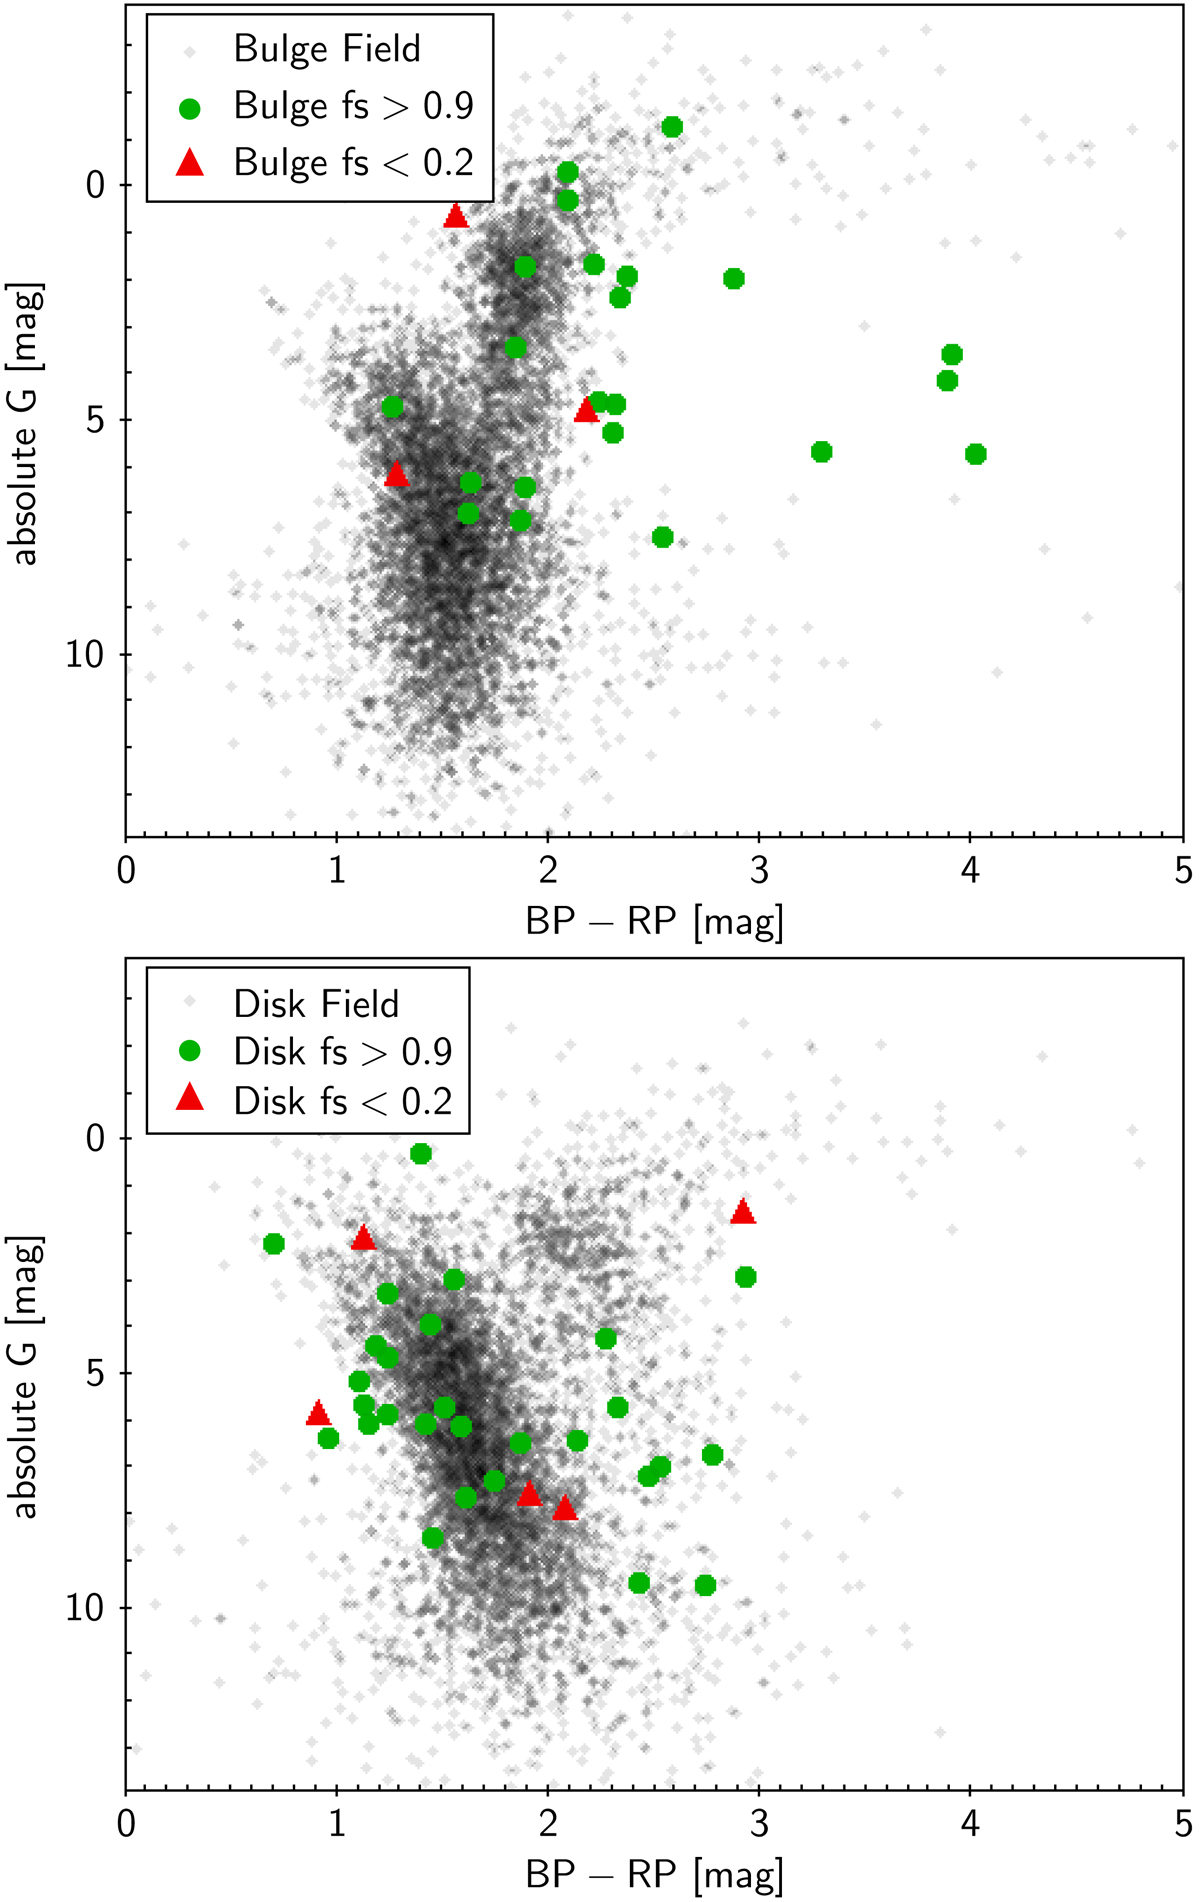
Download original image
Colour–magnitude diagrams with absolute G derived using Gaia EDR3 parallaxes. The same typical stellar field was used for bulge (upper plot) and disc (lower plot) as in Fig. 9 (black/blue points), with the cut on parallax_over_error > 1. The baseline magnitudes from Level 1 were used to show microlensing events for G-band as well as for the colour computation. Baseline magnitudes most likely indicate the source for non-blended events (fs > 0.9) and the lens for highly blended events (fs < 0.2).
Current usage metrics show cumulative count of Article Views (full-text article views including HTML views, PDF and ePub downloads, according to the available data) and Abstracts Views on Vision4Press platform.
Data correspond to usage on the plateform after 2015. The current usage metrics is available 48-96 hours after online publication and is updated daily on week days.
Initial download of the metrics may take a while.