Fig. 5.
Download original image
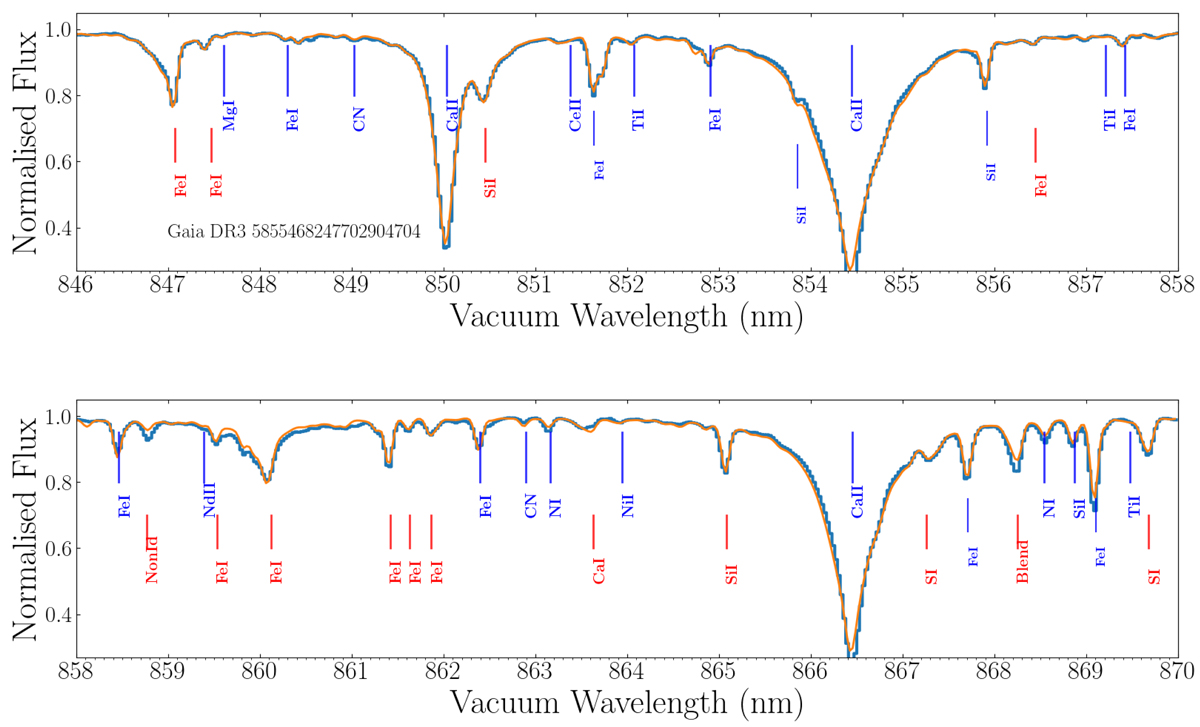
Observed (blue histogram) and synthetic (orange line) spectra of the Cepheid variable star Gaia DR3 5855468247702904704. The observed spectrum has a very high S/N (equal to 884) and its histogram bin size corresponds to the wavelength sampling adopted for the analysis (0.03 nm, 800 wlp). The synthetic spectrum was computed from the GSP-Spec MatisseGauguin atmospheric parameters (Teff = 5477 K, log(g) = 1.44, [M/H] = 0.07 dex, [α/Fe] = 0.11 dex) and individual chemical abundances, was then convolved by a rotational profile to reproduce the CU6 estimated broadening velocity (15.6 km s−1) and, finally, was degraded to the RVS spectral resolution and sampling. The atomic lines identified in blue belong to the chemical species whose abundances were derived by the GAUGUIN method (the local normalisation performed for the chemical analysis of these selected lines was not considered in the figure for clarity reasons). The lines in red were not analysed in the shown spectrum because of suspected blends in the present case. The feature around 868.3 nm is a blend of SI+FeI+SiI plus probably other potential unidentified lines. The NonId feature at ∼858.8 nm is a blend of the Fe II line described in Sect. 8.7.2 (seen in orange) and of unidentified lines that cannot be reproduced with the present line list.
Current usage metrics show cumulative count of Article Views (full-text article views including HTML views, PDF and ePub downloads, according to the available data) and Abstracts Views on Vision4Press platform.
Data correspond to usage on the plateform after 2015. The current usage metrics is available 48-96 hours after online publication and is updated daily on week days.
Initial download of the metrics may take a while.