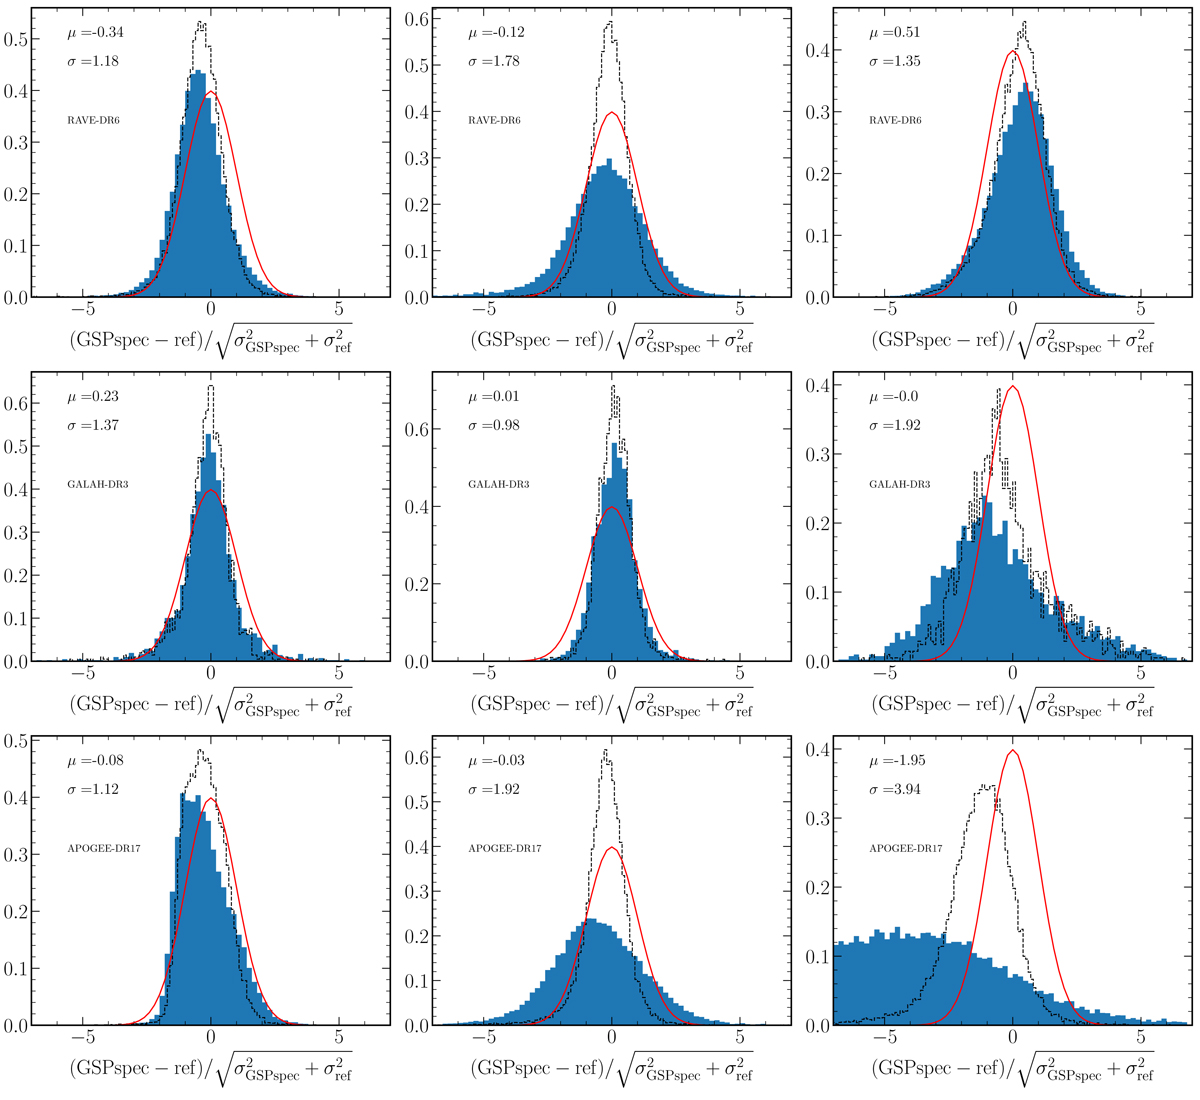
Fig. D.3.
Download original image
Distributions of parameter differences, normalised with respect to the reported GSP-Spec and literature uncertainties. From left to right: Teff, log(g), and [M/H] differences. From up to bottom: Differences with respect to RAVE-DR6, GALAH-DR3, and APOGEE-DR17. Dotted histograms correspond to the same distributions inflating the uncertainties (GSP-Spec and literature) by a factor of 4. The red curve shows a normal distribution of unit dispersion and zero mean. An unbiased parameter estimation with correct uncertainties should follow this distribution.
Current usage metrics show cumulative count of Article Views (full-text article views including HTML views, PDF and ePub downloads, according to the available data) and Abstracts Views on Vision4Press platform.
Data correspond to usage on the plateform after 2015. The current usage metrics is available 48-96 hours after online publication and is updated daily on week days.
Initial download of the metrics may take a while.