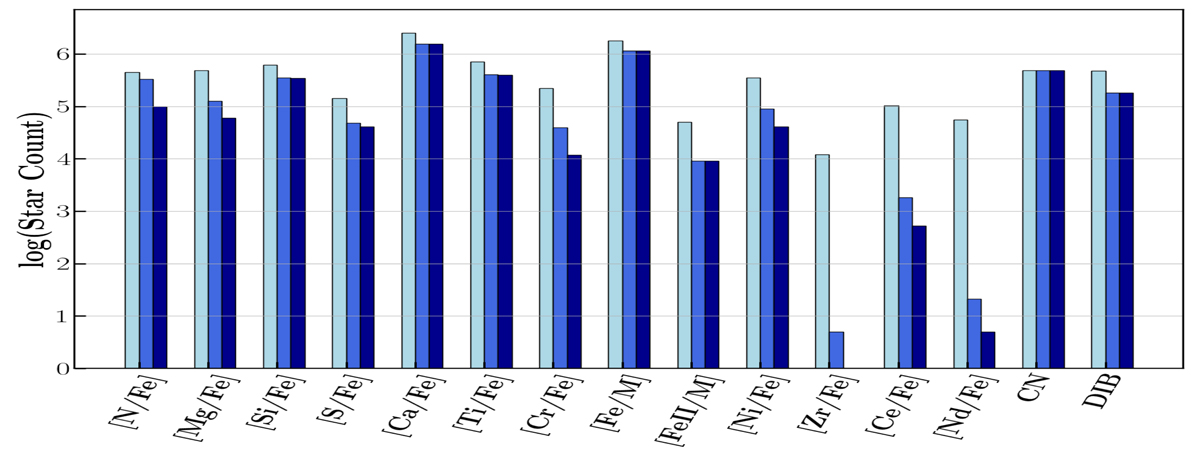
Fig. 18.
Download original image
Same as Fig. 17 but for the individual abundances derived by GAUGUIN plus the CN-abundance proxy and the DIB. The light-blue histogram (left bars) refers to the whole sample. The two other sets of bars (central and right bars) show only the very best stars with all their parameter flags and their abundance uncertainty quality equal to zero. The abundance upper limit flag is lower than or equal to one and equal to zero for the medium-blue and dark-blue bars, respectively.
Current usage metrics show cumulative count of Article Views (full-text article views including HTML views, PDF and ePub downloads, according to the available data) and Abstracts Views on Vision4Press platform.
Data correspond to usage on the plateform after 2015. The current usage metrics is available 48-96 hours after online publication and is updated daily on week days.
Initial download of the metrics may take a while.