Fig. 14.
Download original image
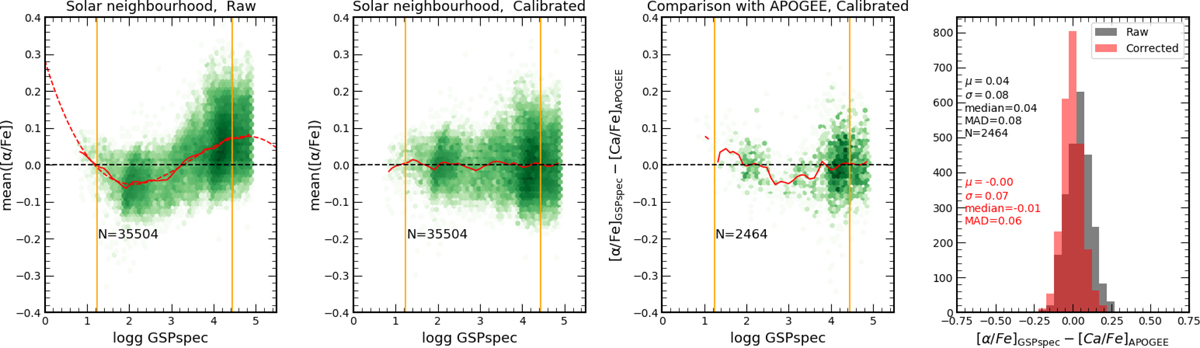
Correction of [α/Fe] trends as a function of log(g). Left panel: the 2D histogram of the stars with 3750 K ≤ Teff < 5750 K, log(g) < 4.9 in green, with all of their quality flags equal to zero, located at the solar neighbourhood, with velocities close to the LSR and metallicities close to solar values in the raw (i.e. uncalibrated) [α/Fe]-log(g) space, colour-coded by log(N). The running mean is plotted as a full red line, and its fit is the red dashed line. The dashed black line is included as a visual reference for the y-axis. Vertical orange lines indicate the log(g) range over which the calibration is assumed to be reliable (differences between the fit and the running mean smaller than 0.05 dex). The second panel is similar to the left one, but the calibration has now been applied. Third panel: the difference between the calibrated [α/Fe] and the calcium values from APOGEE DR17 as a function of MatisseGauguin log(g), where we have relaxed the extrapol flag to be less than or equal to one. Finally, the right panel shows the histograms of the differences compared to the literature data before (in grey) and after (in red) the calibration. Quantifications of the mean, median, standard deviation, and robust standard deviation (1.4826⋅ MAD) are shown in the top left corner for the uncalibrated values (in grey) and in the bottom right corner for the calibrated values (in red).
Current usage metrics show cumulative count of Article Views (full-text article views including HTML views, PDF and ePub downloads, according to the available data) and Abstracts Views on Vision4Press platform.
Data correspond to usage on the plateform after 2015. The current usage metrics is available 48-96 hours after online publication and is updated daily on week days.
Initial download of the metrics may take a while.