Fig. 12.
Download original image
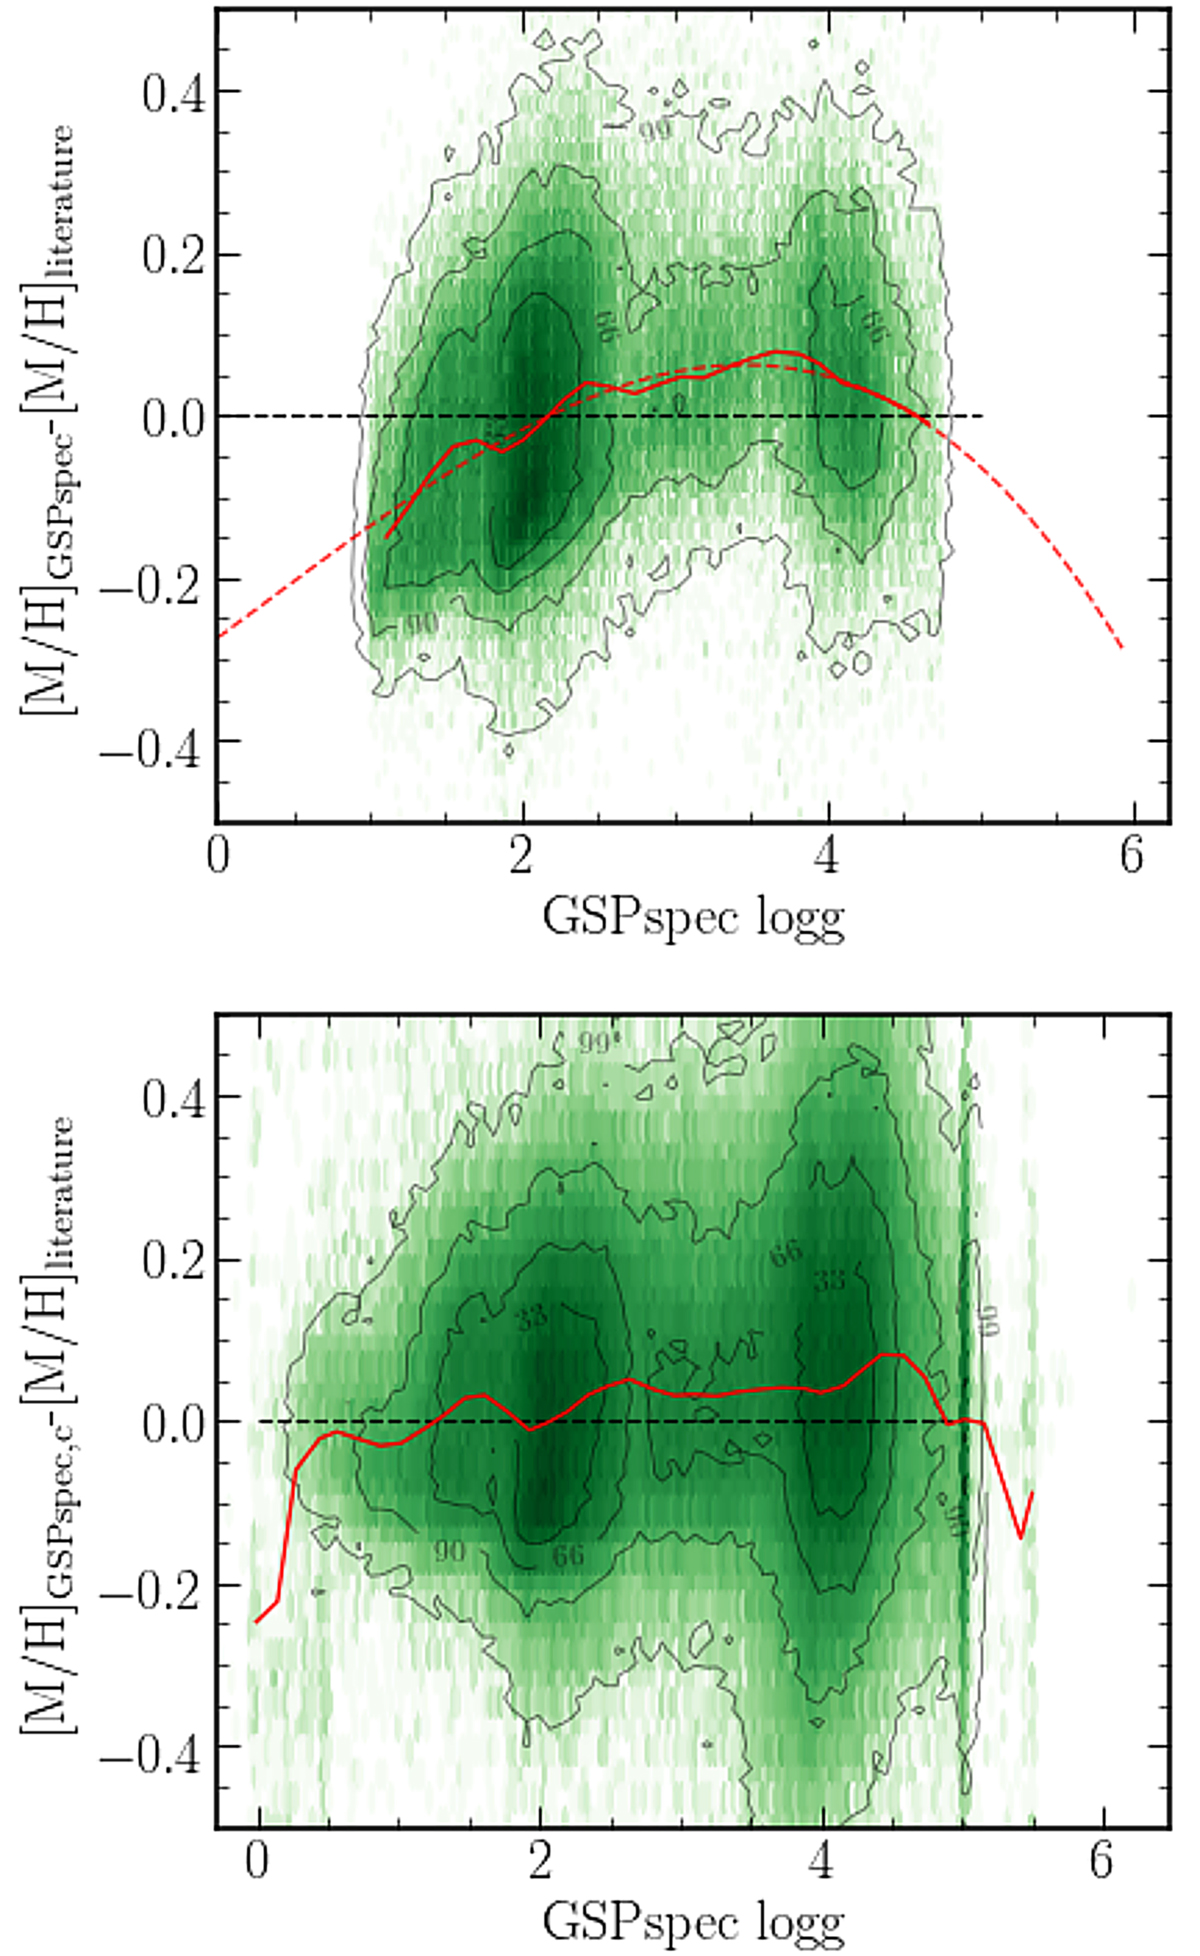
Comparison of GSP-Spec and literature metallicities. Top: 2D histogram of the differences between the GSP-Spec metallicities and the literature values as a function of uncalibrated log(g) for our best-quality sample. The red full line is the running mean of the difference, and the dashed line is the fit to the running mean, defining the correction to apply. Bottom: medium-quality sample showing the differences between the calibrated metallicities and the literature values.
Current usage metrics show cumulative count of Article Views (full-text article views including HTML views, PDF and ePub downloads, according to the available data) and Abstracts Views on Vision4Press platform.
Data correspond to usage on the plateform after 2015. The current usage metrics is available 48-96 hours after online publication and is updated daily on week days.
Initial download of the metrics may take a while.