Fig. 11.
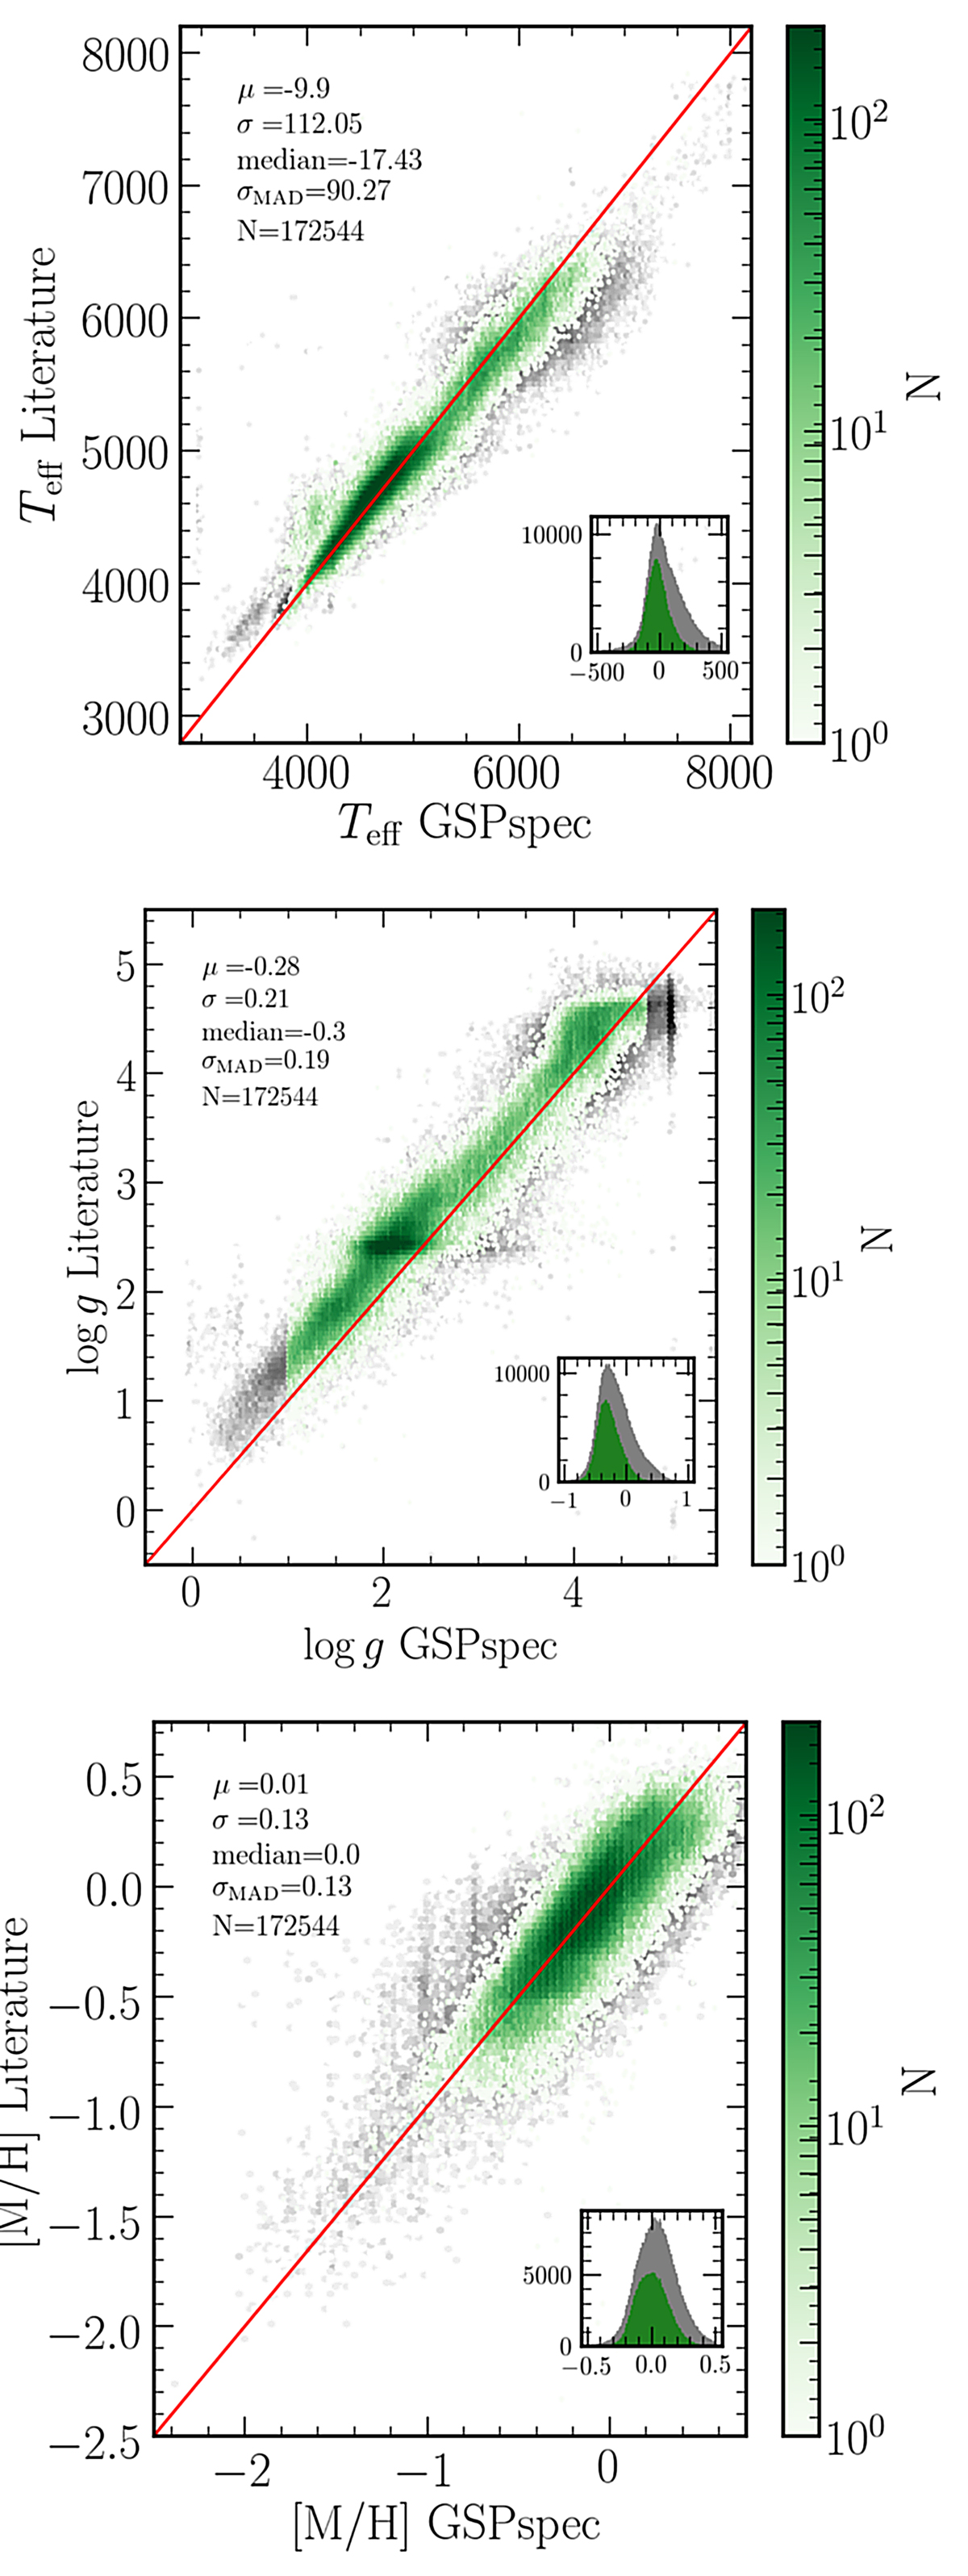
Download original image
Density plots comparing GSP-Spec MatisseGauguin parameters with literature data (APOGEE-DR17, GALAH-DR3, RAVE-DR6). Green and grey show the best- and medium-quality subsamples, respectively (see text for details about these samples). The histograms inside each plot show the difference between the literature and the GSP-Spec parameters. Mean (μ), standard deviation (σ), median, robust standard deviation (derived from the MAD), and the number of stars (N) of the offsets for the best-quality subset are annotated inside each box.
Current usage metrics show cumulative count of Article Views (full-text article views including HTML views, PDF and ePub downloads, according to the available data) and Abstracts Views on Vision4Press platform.
Data correspond to usage on the plateform after 2015. The current usage metrics is available 48-96 hours after online publication and is updated daily on week days.
Initial download of the metrics may take a while.