Fig. 9.

Download original image
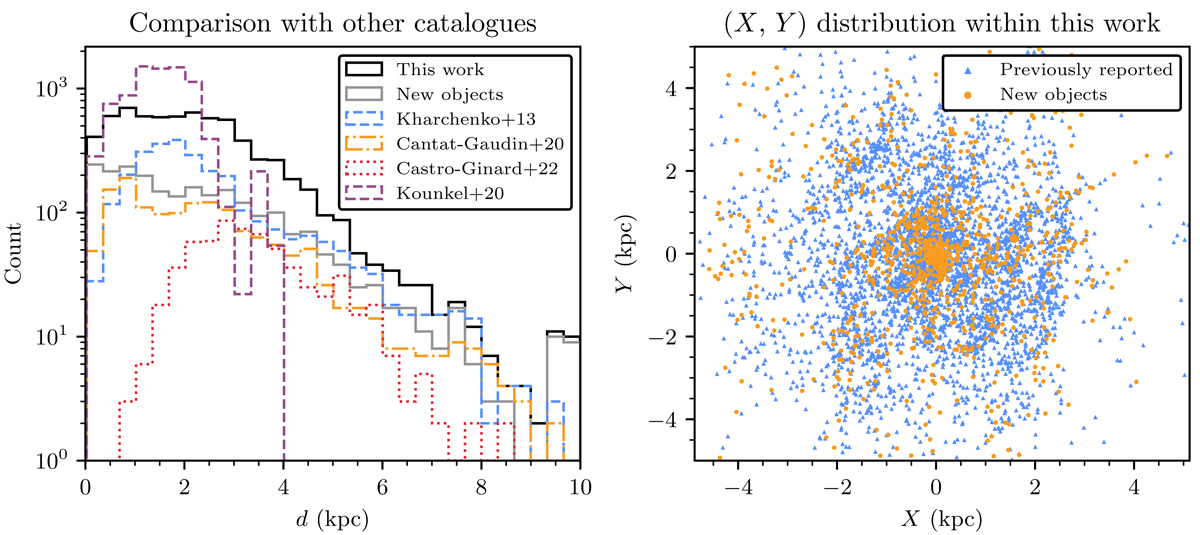
Distance and spatial distributions of clusters in this work. Left: the distance distribution of all clusters in this work that do not crossmatch to known GCs compared to other catalogues. Right: The distribution of clusters in this work in Cartesian coordinates centred on the Sun, cut to only those within 5 kpc in the X or Y directions. All previously reported clusters that we redetect are shown as blue triangles, and all objects new in this work shown as orange circles.
Current usage metrics show cumulative count of Article Views (full-text article views including HTML views, PDF and ePub downloads, according to the available data) and Abstracts Views on Vision4Press platform.
Data correspond to usage on the plateform after 2015. The current usage metrics is available 48-96 hours after online publication and is updated daily on week days.
Initial download of the metrics may take a while.


