Fig. 12.

Download original image
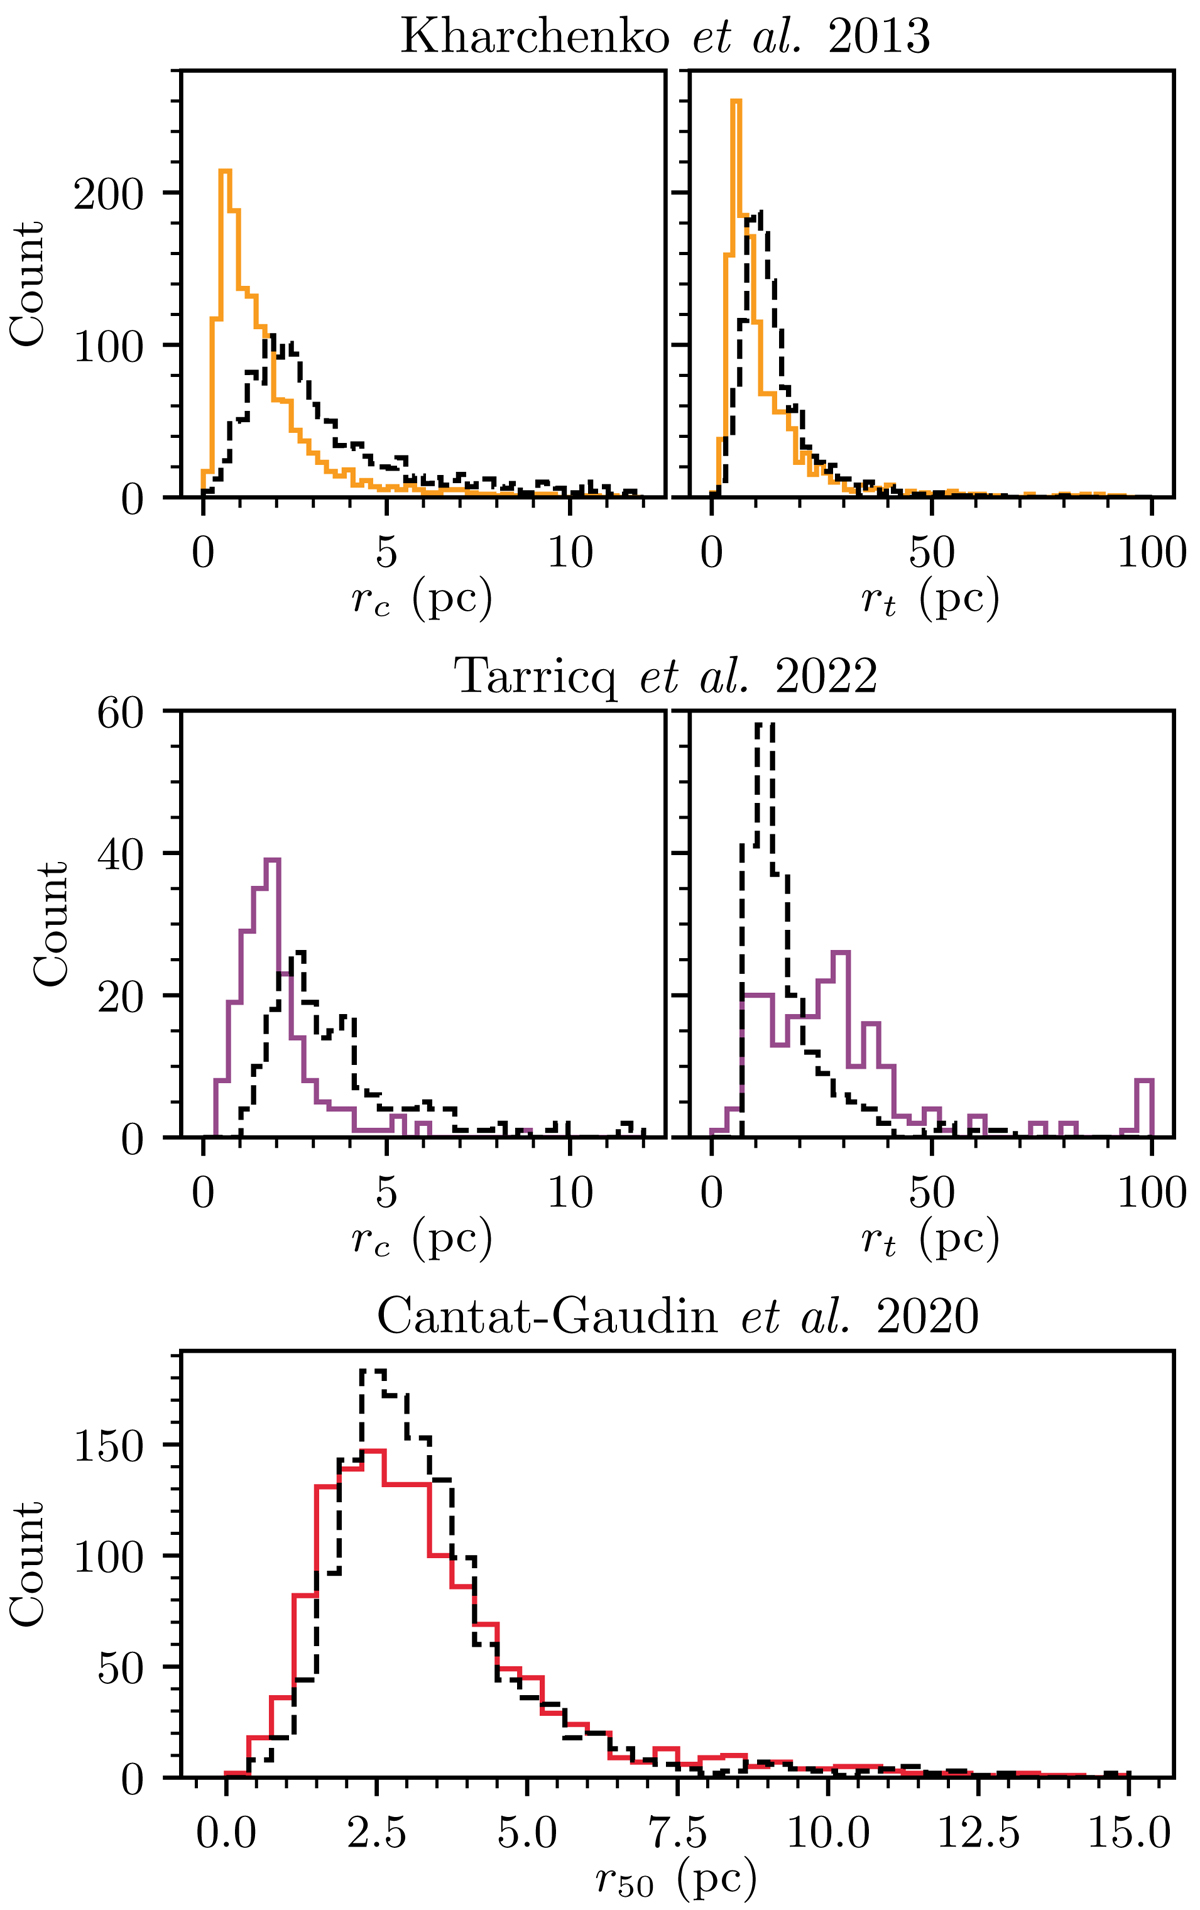
Cluster radii derived in this work (dashed black line) compared against the distributions of cluster radii in various literature works. Top row: rc (top left) and rt (top right) of 1446 clusters from Kharchenko et al. (2013) that we redetect in this work (solid orange curve) compared against our approximately estimated King (1962) radii for these 1446 clusters. Middle row: same as top, except for radii of 202 clusters from Tarricq et al. (2022) that have derived King radii (solid purple curve). Bottom: r50 measurements from Cantat-Gaudin & Anders (2020) compared against our r50 measurements for the 1343 clusters from their work that we redetect.
Current usage metrics show cumulative count of Article Views (full-text article views including HTML views, PDF and ePub downloads, according to the available data) and Abstracts Views on Vision4Press platform.
Data correspond to usage on the plateform after 2015. The current usage metrics is available 48-96 hours after online publication and is updated daily on week days.
Initial download of the metrics may take a while.


