Fig. 5
Download original image
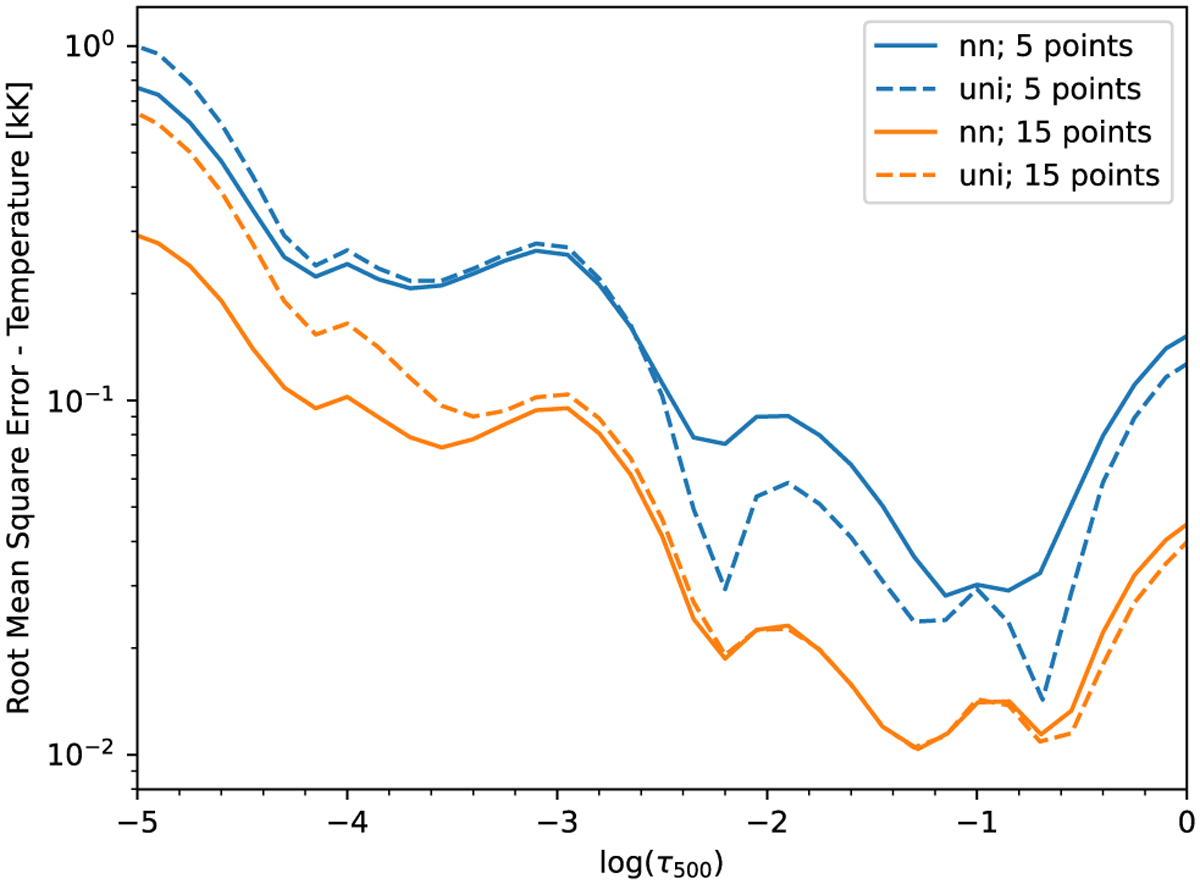
Root mse of the network used as a predictor of the temperature stratification when there are 5 points (blue lines) and when there are 15 points (orange lines) in the whole wavelength range. The solid lines represent the error of the inferred sampling method, and the dashed lines are produced using the uniform sampling scheme.
Current usage metrics show cumulative count of Article Views (full-text article views including HTML views, PDF and ePub downloads, according to the available data) and Abstracts Views on Vision4Press platform.
Data correspond to usage on the plateform after 2015. The current usage metrics is available 48-96 hours after online publication and is updated daily on week days.
Initial download of the metrics may take a while.