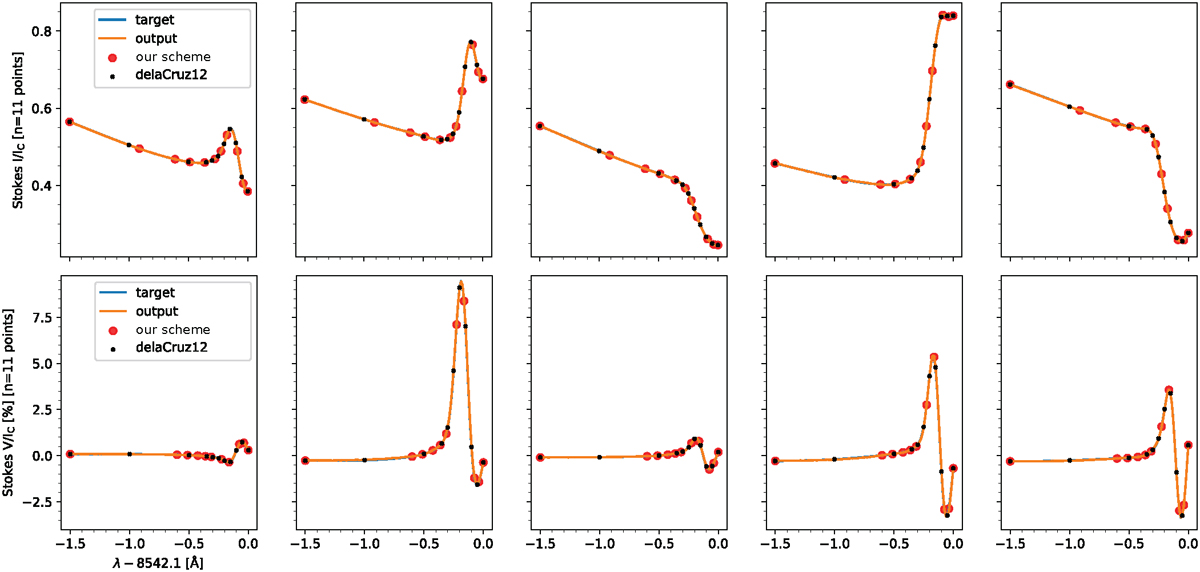
Fig. 3
Download original image
Output sampling scheme as seen in five different profiles for Stokes I (upper panel) and Stokes V (lower panel) for the Ca II 8542 Å line. The sampling scheme suggested in de la Cruz Rodríguez et al. (2012) is also shown for comparison. The predicted profiles (output) are not visible because they are aligned behind synthetic profiles (target).
Current usage metrics show cumulative count of Article Views (full-text article views including HTML views, PDF and ePub downloads, according to the available data) and Abstracts Views on Vision4Press platform.
Data correspond to usage on the plateform after 2015. The current usage metrics is available 48-96 hours after online publication and is updated daily on week days.
Initial download of the metrics may take a while.