Fig. 5
Download original image
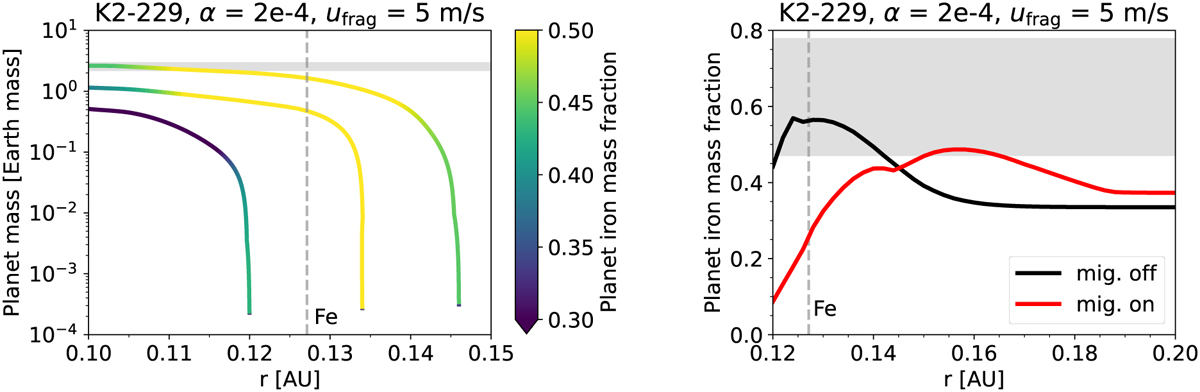
Planetary growth tracks and iron mass fraction as a function of orbital distance from the star. Left panel: example growth tracks of planetary seeds placed initially in the vicinity of the iron evaporation front (grey dashed line) and the evolution of their iron mass fraction. Planetary seeds accrete iron-rich pebbles as they approach the iron evaporation front while the planetary iron mass fraction starts to drop as they migrate past the iron evaporation fornt. The horizontal grey band encompass the mass range of K2-229b. Right panel: final iron abundance of a migrating and non-migrating planet as a function of their initial semi-major axis. The maximum iron mass fraction achieved by a migrating planet is lower because it accretes iron-poor material as it migrates toward the disc inner edge. The grey band represents the range of values for the iron mass fraction of K2-229b.
Current usage metrics show cumulative count of Article Views (full-text article views including HTML views, PDF and ePub downloads, according to the available data) and Abstracts Views on Vision4Press platform.
Data correspond to usage on the plateform after 2015. The current usage metrics is available 48-96 hours after online publication and is updated daily on week days.
Initial download of the metrics may take a while.