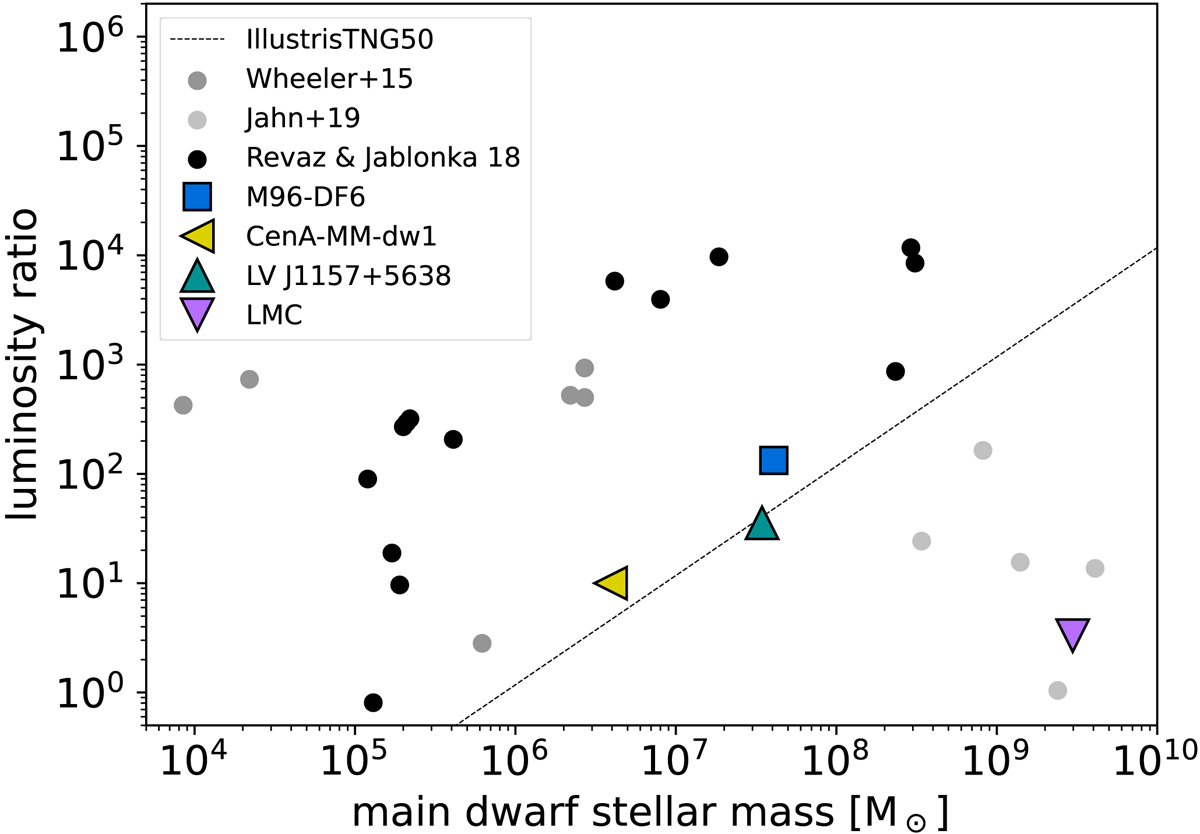
Fig. 7.
Download original image
Simulated and observed luminosity ratios of satellite-of-satellite systems as a function of the luminosity of the main dwarf. The gray dots correspond to the six satellite-of-satellite systems analyzed in the FIRE simulation (Wheeler et al. 2015), and the black dots show the 14 satellite-of-satellite systems identified in the zoom-in simulations of Revaz & Jablonka (2018). The colored square and triangles are measurements from observed satellite-of-satellite systems. The line indicates the resolution limit of the Illustris-TNG50 simulation.
Current usage metrics show cumulative count of Article Views (full-text article views including HTML views, PDF and ePub downloads, according to the available data) and Abstracts Views on Vision4Press platform.
Data correspond to usage on the plateform after 2015. The current usage metrics is available 48-96 hours after online publication and is updated daily on week days.
Initial download of the metrics may take a while.