Fig. 3.
Download original image
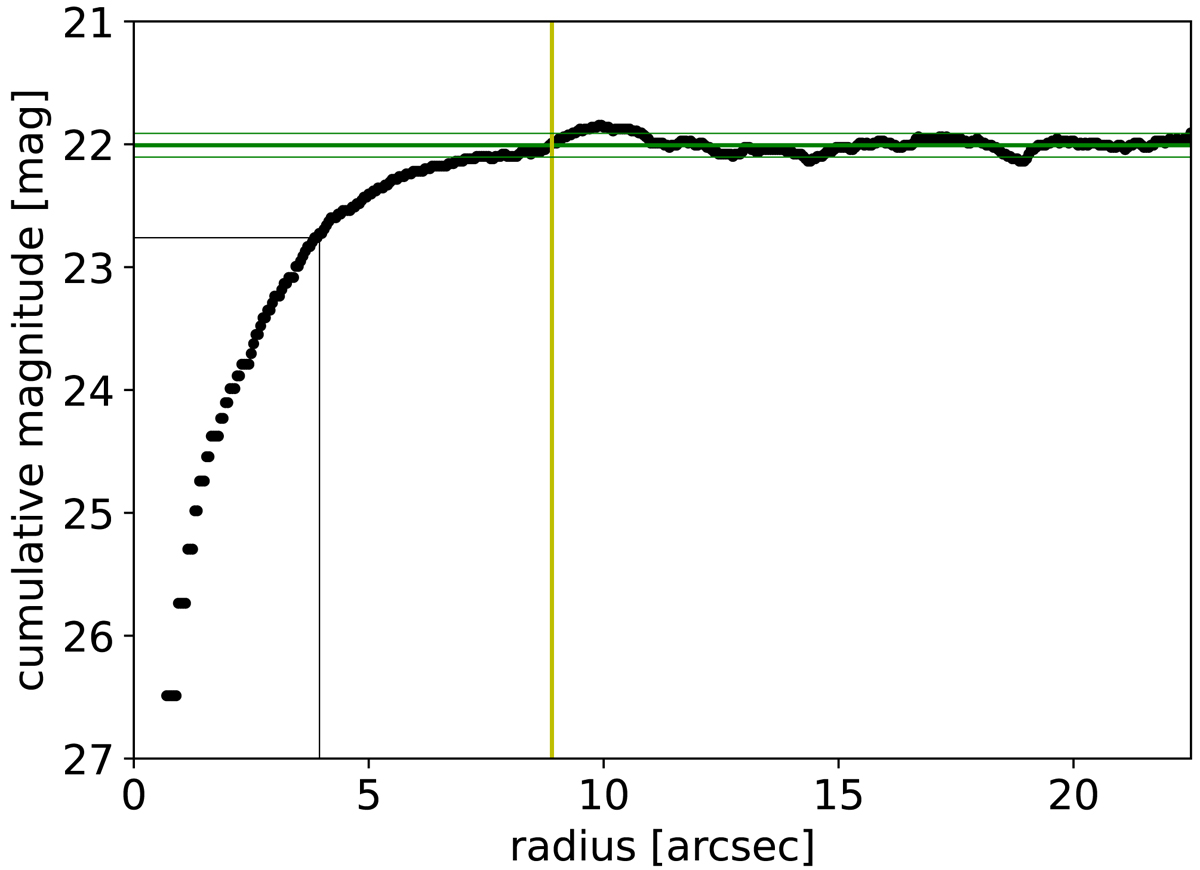
Magnitude growth curve in the F606W band of the newly discovered dwarf galaxy dw1046+1244. The thick green horizontal line indicates the estimated total magnitude, and the two thin green lines correspond to ±2 standard deviations around it. The vertical yellow line indicates the radius where the magnitude reaches the background. The two black lines correspond to the distance where the curve reaches half the flux, which is the estimation of the effective radius.
Current usage metrics show cumulative count of Article Views (full-text article views including HTML views, PDF and ePub downloads, according to the available data) and Abstracts Views on Vision4Press platform.
Data correspond to usage on the plateform after 2015. The current usage metrics is available 48-96 hours after online publication and is updated daily on week days.
Initial download of the metrics may take a while.