Open Access
Fig. 2.
Download original image
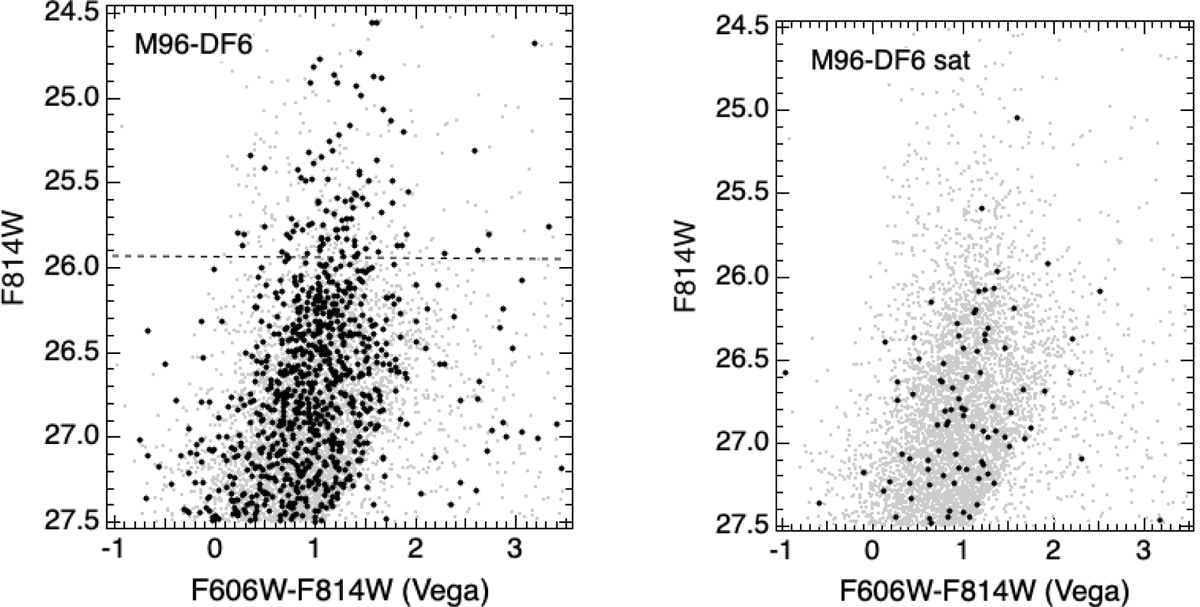
CMDs for M96-DF6 and the M96-DF6 satellite dw1046+1244. The gray dots are all point sources passing the photometric quality cuts detected over the entire FoV. The dashed line in the left graph indicates the magnitude of the TRGB derived by Cohen et al. (2018).
Current usage metrics show cumulative count of Article Views (full-text article views including HTML views, PDF and ePub downloads, according to the available data) and Abstracts Views on Vision4Press platform.
Data correspond to usage on the plateform after 2015. The current usage metrics is available 48-96 hours after online publication and is updated daily on week days.
Initial download of the metrics may take a while.